
Optimus Prime Indicator by TraderOracle
Version: 1.8
OptimusNinja
Send download link to:
Author: TraderOracle
Discord: Join Our Community
Overview
The Optimus Prime Indicator by TraderOracle is a comprehensive technical analysis tool designed to help traders identify market trends, reversals, and key entry/exit points. With a wide array of customizable settings, the indicator incorporates several well-known strategies such as MACD, Parabolic SAR, Squeeze Momentum, Waddah Attar Explosion, Fisher Transform, SuperTrend, T3, Hull Moving Average (HMA), and Awesome Oscillator. These strategies work together to provide clear and actionable buy/sell signals.
Optimus Prime is tailored for intraday and swing traders who need reliable signals based on volume imbalances, price action, and multiple technical filters. By analyzing key market metrics, this indicator is capable of showing regular buy/sell signals, MACD/PSAR-based large arrows, volume imbalances, and advanced reversal patterns.
The tool is particularly powerful due to its flexible design, allowing traders to filter out unnecessary signals and focus on the ones that matter most for their strategy. The indicator can also trigger alerts, play sounds, and send email notifications when specific conditions are met.
Key Features
- Buy/Sell Filters:
- Waddah Explosion: Detects explosive market movements using the Waddah Attar Explosion algorithm.
- Awesome Oscillator (AO): Measures market momentum to identify potential trend reversals.
- Parabolic SAR (PSAR): Provides trailing stop signals to capture trend direction.
- Squeeze Momentum: Identifies periods of low volatility that may precede significant price movements.
- Linda MACD: An enhanced version of the MACD indicator for more precise trend analysis.
- Hull Moving Average (HMA): A fast and smooth moving average that reduces lag.
- SuperTrend: A trend-following indicator that adjusts based on market volatility.
- T3 Moving Average: A triple-smoothed moving average that reduces noise.
- Fisher Transform: Converts price into a Gaussian normal distribution for better signal clarity.
- Advanced Signals:
- Regular Buy/Sell Arrows: Standard signals indicating potential entry and exit points.
- MACD/PSAR Big Arrows: Enhanced signals combining MACD and PSAR indicators for stronger confirmations.
- Volume Imbalances: Highlights significant volume disparities between bid and ask, indicating potential reversals.
- Trampoline (TR) Signals: Detects specific candlestick patterns and RSI conditions for trend confirmations.
- Reversal Patterns: Identifies common candlestick reversal patterns like Three Outside Up/Down and Wick Reversals.
- Reversal Square: Marks areas on the chart where significant price reversals are likely.
- Evil Times: Displays specific market time events that may impact trading decisions (e.g., Market Pivot, Euro Move, Bond Auctions).
- Colored Candles:
- Waddah Candles: Changes candle colors based on Waddah Attar Explosion intensity.
- Linda MACD Candles: Colors candles based on the Linda MACD intensity.
- Alerts and Notifications:
- Sound Alerts: Plays customizable sounds for buy/sell signals.
- Email Alerts: Sends email notifications for significant trading signals and events.
- Customization Options:
- Text Display: Adjustable text size, position (above/below candles), color, and opacity.
- Indicator Tick Offset: Fine-tune the placement of text labels on the chart.
Understanding the Signals
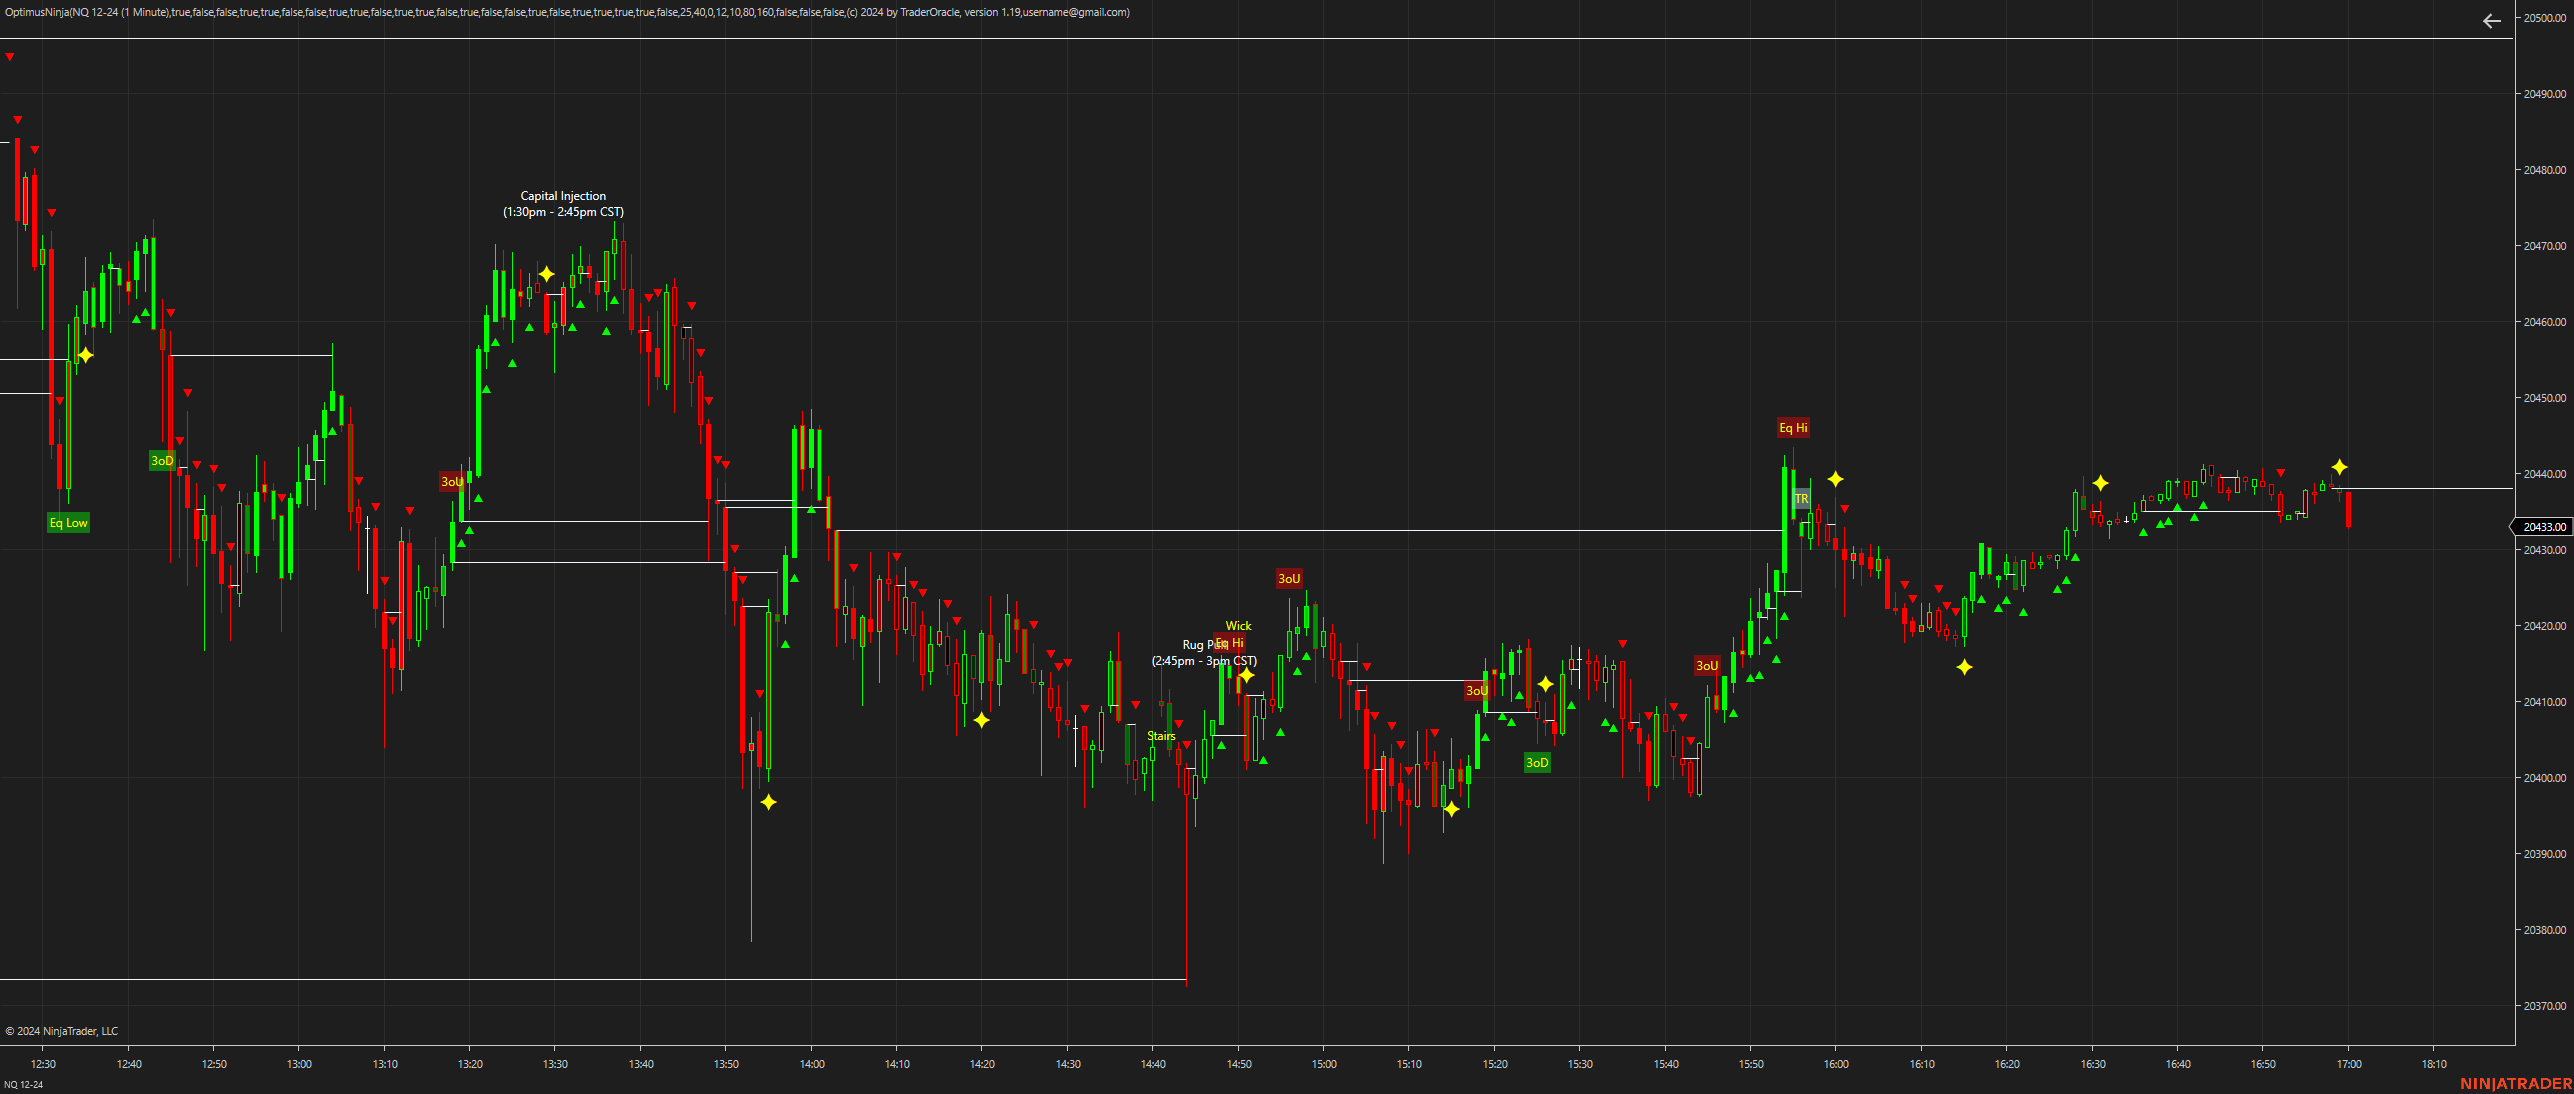
The Optimus Prime Indicator overlays various signals and texts on your trading chart to assist in making informed trading decisions. Below is a detailed explanation of each signal and what it represents:
- Buy/Sell Arrows (▴ / ▾):
- ▴ (Up Arrow): Indicates a Buy Signal based on the convergence of multiple indicators such as MACD, PSAR, Fisher Transform, T3, Waddah, SuperTrend, Squeeze Momentum, and others. When conditions are favorable, an upward arrow appears, suggesting a potential long position.
- ▾ (Down Arrow): Indicates a Sell Signal when the opposite conditions are met, signaling a potential short position.
- Explosion Indicator (✦):
- ✦ (Star Symbol): Represents the Squeeze Momentum signal. When the market is in a squeeze (low volatility) and begins to explode (high volatility), a star symbol is displayed to highlight this potential breakout opportunity.
- Reversal Patterns:
- 3oU (Three Outside Up): A bullish reversal pattern indicating that the price may reverse upwards.
- 3oD (Three Outside Down): A bearish reversal pattern suggesting a potential downward price reversal.
- Wick: Highlights candles with significant wicks, indicating possible reversals or exhaustion of the current trend.
- Eq Hi / Eq Low (Equal High / Equal Low): Signals areas where the price has equal highs or lows over consecutive bars, suggesting potential support or resistance zones.
- Trampoline (TR):
- TR (Trampoline): Displays during specific RSI conditions combined with candlestick patterns, indicating strong trend confirmations either bullish or bearish.
- Reversal Square:
- Square Markers: Visual squares on the chart denote significant price levels where reversals are likely to occur based on volume imbalances and other indicators.
- Volume Imbalances:
- Lines and Markers: Represents areas where there is a significant imbalance between buying and selling volume, indicating potential price reversals or continuations.
- Evil Times:
- Text Labels: Displays specific market time events that could influence trading, such as:
- Market Pivot (9 – 10am CST): Key market opening hours.
- Euro Move (10 – 10:30am CST): Period when European markets influence price movements.
- Inverse (10:30 – 12pm CST): Times when inverse market movements are common.
- Bond Auctions (12pm – 1:30pm CST): When bond auctions occur, potentially impacting price action.
- Capital Injection (1:30pm – 2:45pm CST): Periods of significant capital movement into the market.
- Rug Pull (2:45pm – 3pm CST): High volatility times indicating potential abrupt price movements.
- Text Labels: Displays specific market time events that could influence trading, such as:
- Colored Candles:
- Waddah Candles: Candles change color based on the intensity of the Waddah Attar Explosion. Green indicates bullish momentum, while red indicates bearish momentum.
- Linda MACD Candles: Colors reflect the intensity of the Linda MACD, providing visual cues on trend strength.
Customization Parameters
Optimus offers a range of customizable settings to tailor the indicator to your trading style and preferences:
- Buy/Sell Filters:
- Enable/Disable: Choose which indicators to incorporate into your buy/sell signal calculations.
- Minimum ADX: Set the minimum Average Directional Index value to filter out weak trends.
- Advanced Settings:
- Show Regular Buy/Sell Arrows: Toggle the display of standard buy/sell arrows.
- Show MACD/PSAR Big Arrows: Enable or disable the larger, more prominent arrows based on MACD and PSAR signals.
- Show Volume Imbalances: Display lines and markers for volume imbalances.
- Show Trampoline Signals: Toggle the display of TR signals.
- Show Reversal Patterns and Squares: Enable the identification and marking of reversal patterns and significant price levels.
- Show Advanced Signals: Display additional advanced signals like Stairs and Wick Reversals.
- Colored Candles:
- Show Waddah Candles: Enable coloring of candles based on Waddah Attar Explosion.
- Waddah Intensity & Buffer: Adjust the sensitivity and buffering of the Waddah indicators.
- Show Linda MACD Candles: Toggle candle coloring based on Linda MACD intensity.
- Linda MACD Intensity: Adjust the sensitivity of the Linda MACD colors.
- Alerts and Notifications:
- Play Alert Sounds: Enable sound alerts for significant trading signals.
- Send Email Alerts: Configure email notifications for buy/sell signals.
- Email Address: Specify the email address to receive alerts.
- Text and Label Customization:
- Alert Text Size: Adjust the size of the text labels on the chart.
- Dots and Arrow Size: Customize the size of the dots and arrows indicating signals.
- Indicator Tick Offset: Fine-tune the vertical placement of text labels relative to the candles.
How to Use Optimus Prime Indicator
- Installation:
- Download the Optimus Prime Indicator file.
- Open NinjaTrader and navigate to the Tools > Import > NinjaScript Add-On.
- Select the downloaded file and follow the prompts to install.
- Adding to a Chart:
- Open a chart for your desired instrument.
- Right-click on the chart, select Indicators, and find Optimus in the list.
- Double-click Optimus to add it to the chart.
- Configure the settings as per your trading strategy and preferences.
- Interpreting Signals:
- Buy/Sell Arrows: Use these as potential entry and exit points.
- Explosion Indicators: Watch for stars (✦) signaling breakout opportunities.
- Reversal Patterns: Look for specific candlestick patterns and labeled reversals to confirm trend changes.
- Volume Imbalances: Pay attention to lines and markers indicating significant volume disparities.
- Evil Times: Be aware of specific market times that may influence price action.
- Customizing Alerts:
- Enable sound and email alerts to stay notified of important signals even when not actively monitoring the chart.
Benefits of Using Optimus Prime Indicator
- Comprehensive Analysis: Combines multiple technical indicators into a single, cohesive tool.
- Customizable: Tailor the indicator to fit your unique trading style and preferences.
- Visual Clarity: Uses colored candles, arrows, and labels to provide clear and actionable signals.
- Enhanced Decision-Making: Offers advanced signals and volume analysis to support informed trading decisions.
- Automated Alerts: Stay informed with customizable sound and email notifications for critical trading signals.