A
Indicators starting with A
-
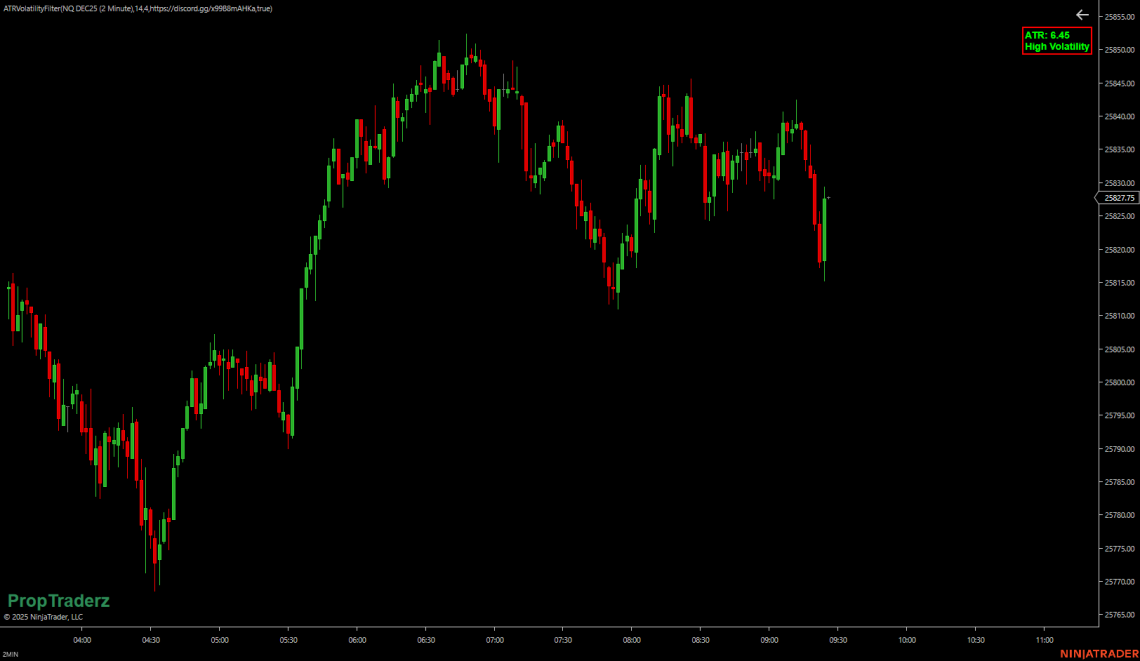
ATR VOLATILITY FILTER
ATR Volatility Filter Know When the Market Is Calm or Ready to Explode Volatility is the pulse of the market. When it beats fast, traders get opportunity — and risk. When it slows down, the game shifts toward patience and precision. Our new ATR Volatility Filter for NinjaTrader 8 gives you a simple, visual way to read that pulse directly on your chart. What It Does This lightweight indicator calculates the Average True Range (ATR) — the classic measure of market volatility — and displays a colored box on your chart showing the current ATR value and volatility state: Low Volatility — the market is quiet, ideal for scalpers or…
-
Average Daily Range ADR Levels
IMPORTANT: Read Before Installing The Average Daily Range Levels indicator is essential for displaying the daily price range on your trading screen, along with projected extensions of that range as the day progresses. Note that to compute an ADR, you must have data for at least as many days as the ADR period you set; this should include weekends, which may lack data. For example, to display a 14-day ADR, ensure you have data for at least 14 actual trading days. Features of the ADR Indicator: Real-Time Updates: The indicator updates live with each price tick. Projection Lines: These are not predictions but are calculated by adding or subtracting the…
-
AbsoluteStrengthV1 -Free Add-On NT8
AbsoluteStrengthV1 -Free Add-On NT8 How it Works: At its core, the AbsoluteStrengthV1 indicator distinguishes between bullish and bearish market forces by measuring their absolute strength. Traders can select between two calculation methods: the RSI Method, which reflects the traditional Relative Strength Index, and the Stoch Method, inspired by Stochastic calculations. Adaptability and Customization: Adaptability is one of the standout features of AbsoluteStrengthV1 The indicator allows users to choose from six different types of moving averages, including Simple (SMA), Exponential (EMA), and more specialized ones like Hull (HMA) and Zero-Lag Exponential (ZLEMA). This level of customization ensures that traders can tailor the indicator to fit their unique trading strategies and market…
-
Auto Swing Indicator with toolbar and comprehensive support/resistance identification
Auto 3 Swing Indicator with toolbar and comprehensive support/resistance identification **NOTE** The version has been updated. The previous version must be uninstalled before importing. 1.Open Ninjatrader 8 2.Click on TOOLS > REMOVE NINJASCRIPT ASSEMBLY 3.Select ActiveGeoking from the list and process removal 4.Import new ZIP file attached to this listing via TOOLS > IMPORT > NINJASCRIPT ADDON Triple Trend Feature In the top right corner of the chart, you will notice SML, MED and LGE printed in either RED or GREEN. GREEN = Trend up RED = Trend down SML is the smallest Zig Zag swing being PINK in colour on the picture in the post above. It is impossible…
-
A Complete Guide to Volume Price Analysis-Anna Coulling
A Complete Guide to Volume Price Analysis” is a book written by Anna Coulling. The book is focused on teaching traders how to use volume and price to analyze financial markets. Volume price analysis for trading success. -The book is divided into several sections that cover topics such as the basics of volume and price analysis, the different types of charts that can be used, and how to interpret price and volume signals. It also covers advanced techniques such as identifying trend reversals and using volume and price to confirm or reject trading signals. The author emphasizes the importance of understanding the relationship between volume and price, as well…
-
Anna Coullings – Volume and Price Analysis
Anna Coulling’s Volume Price Analysis book is a comprehensive guide to understanding how volume and price interact in the markets. It covers the basics of volume and price analysis, as well as more advanced topics such as candlestick analysis, trendlines, support and resistance, and Fibonacci retracements. The book also provides detailed explanations of the different types of volume indicators and how they can be used to identify trading opportunities. Additionally, it includes numerous examples and case studies to help readers understand the concepts better. Overall, Anna Coulling’s Volume Price Analysis book is an invaluable resource for traders who want to gain a deeper understanding of how volume and price interact…