-
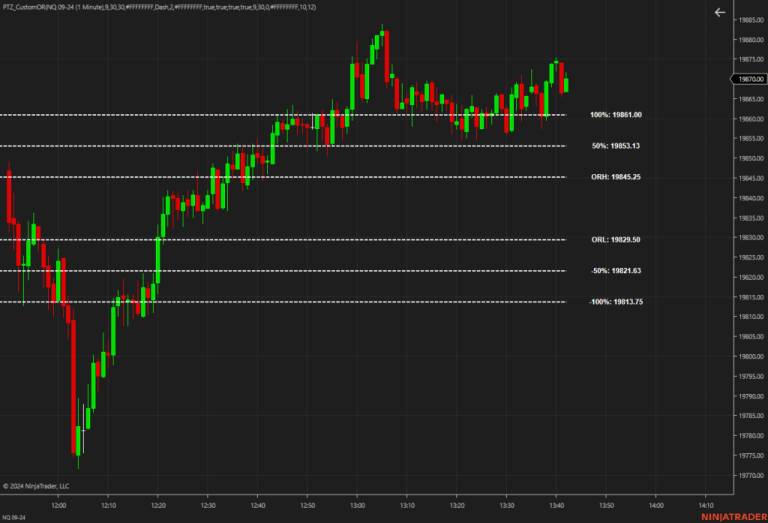
MGI LEVELS
Levels indicator (market generated information) plots all the key price references you need automatically — previous day, week, and month highs, lows, opens, closes, VAH, VAL, POC, Initial Balance and Overnight levels — all directly on your NinjaTrader chart. Every level has its own toggle so you see exactly what you want, nothing more. Clean chart, zero manual work, every session. Built for serious futures traders who trade ES, NQ and other CME products and want their key levels ready before the open — not after. Includes: Previous Day / Week / Month: High, Low, Open, Close, VAH, VAL, POC Initial Balance: High, Low, Mid Overnight: High, Low Day Open,…
-
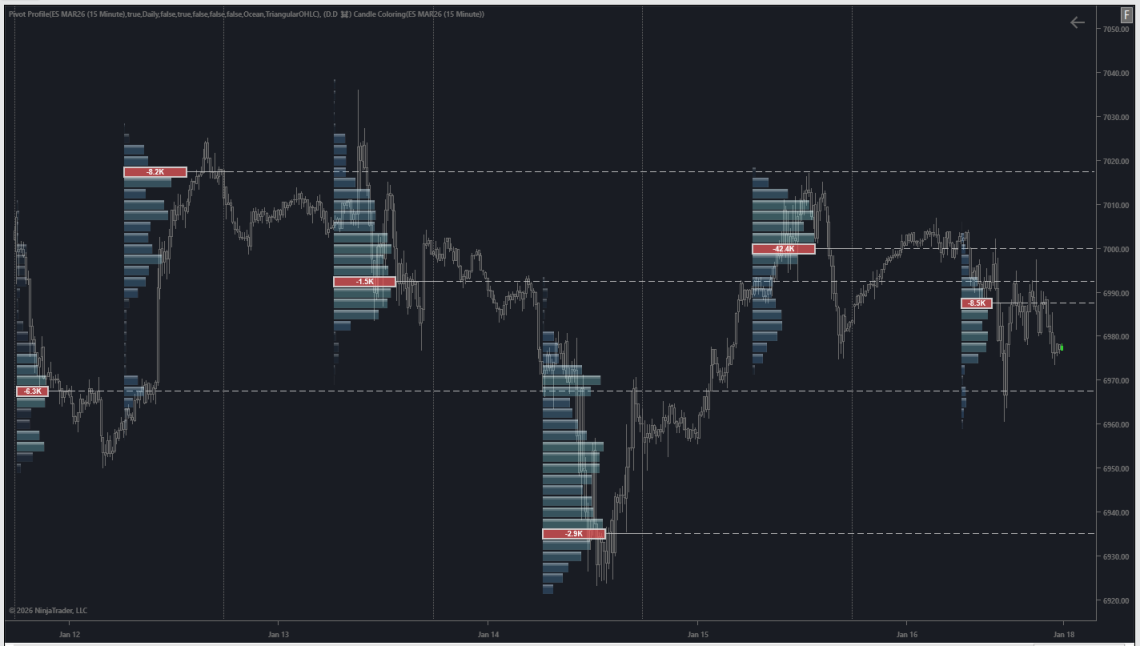
PIVOT PROFILES
Indicator made by Dr. Doom Pivot / TPO Profiles – Advanced Structure View The Pivot Profiles indicator for NinjaTrader combines session-based volume profiles with auction structure analysis, offering a precise view of POC, Value Area, Initial Balance (IB), and VWAP across daily, weekly, or custom sessions. Multiple volume calculation modes are supported: EvenSplit – neutral distribution for clean structure analysis CloseWeighted – emphasizes acceptance near closing prices Triangular OHLC – approximates time/price participation within each bar Volume at Price (VAP) – tick-accurate volume distribution for detailed profiling The indicator highlights single prints, excess, balance vs. imbalance, and key inflection zones, making it suitable for context-driven execution, rotations, and Failed Breakdown logic,…
-
TPO Profiles Indicator for NinjaTrader
Indicator made by Dr. Doom More about TPO here About the TPO Profiles Indicator The TPO Profiles indicator for NinjaTrader is designed to visualize market structure and auction behavior using Time Price Opportunity (TPO) analysis. This indicator supports custom sessions, including daily, weekly, and session-based profiles, allowing traders to analyze structure across multiple time horizons. It highlights key auction concepts such as value areas, balance vs. imbalance, and directional intent. Key features include: Daily, weekly, and custom session TPO profiles Single prints for identifying excess, initiative activity, and potential repair zones Clear visualization of market structure, helping distinguish acceptance from rejection Flexible configuration to adapt to different markets and trading…
-
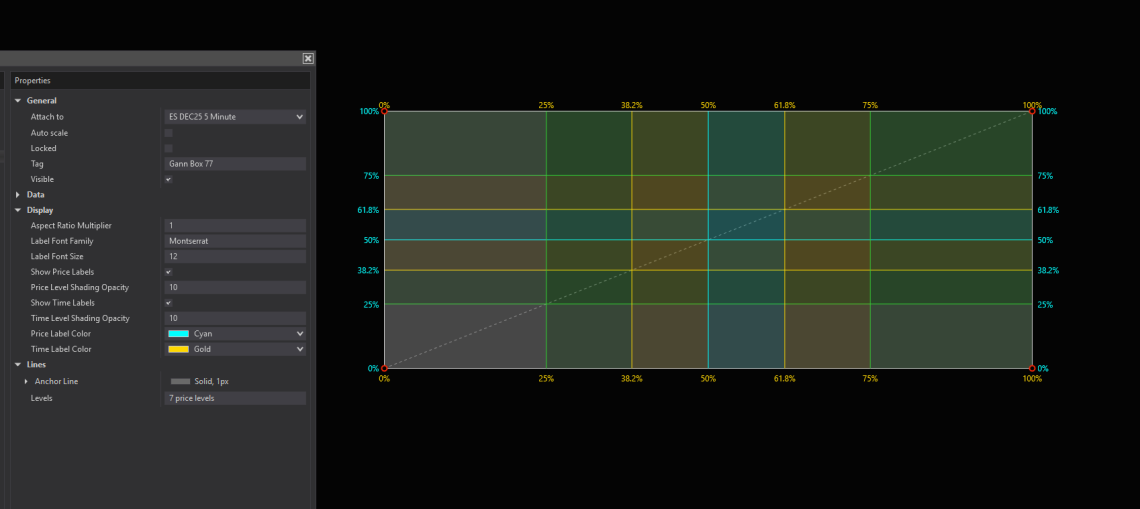
Advanced Gann Box for NinjaTrader
Advanced Gann Box for NinjaTrader 8 Free precision tool created by CampervanSeth — shared by PropTraderz Bring precision, geometry, and balance to your chart analysis with the Advanced Gann Box — rooted in W.D. Gann principles and enhanced for modern futures trading. Key Features Dual Synchronization of Price and Time Levels Dynamic Shading & Opacity Control Adjustable Aspect Ratio Multiplier Full Label Customization (fonts, colors, sizes) Smooth Interaction & Editing with aspect-ratio lock Enhanced Visual Design – crisp DirectX rendering Works on all futures contracts • 100% Free
-
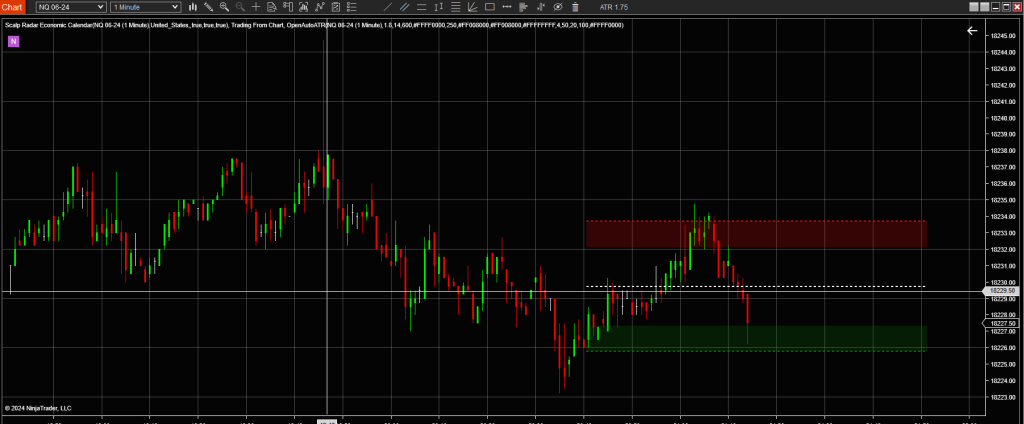
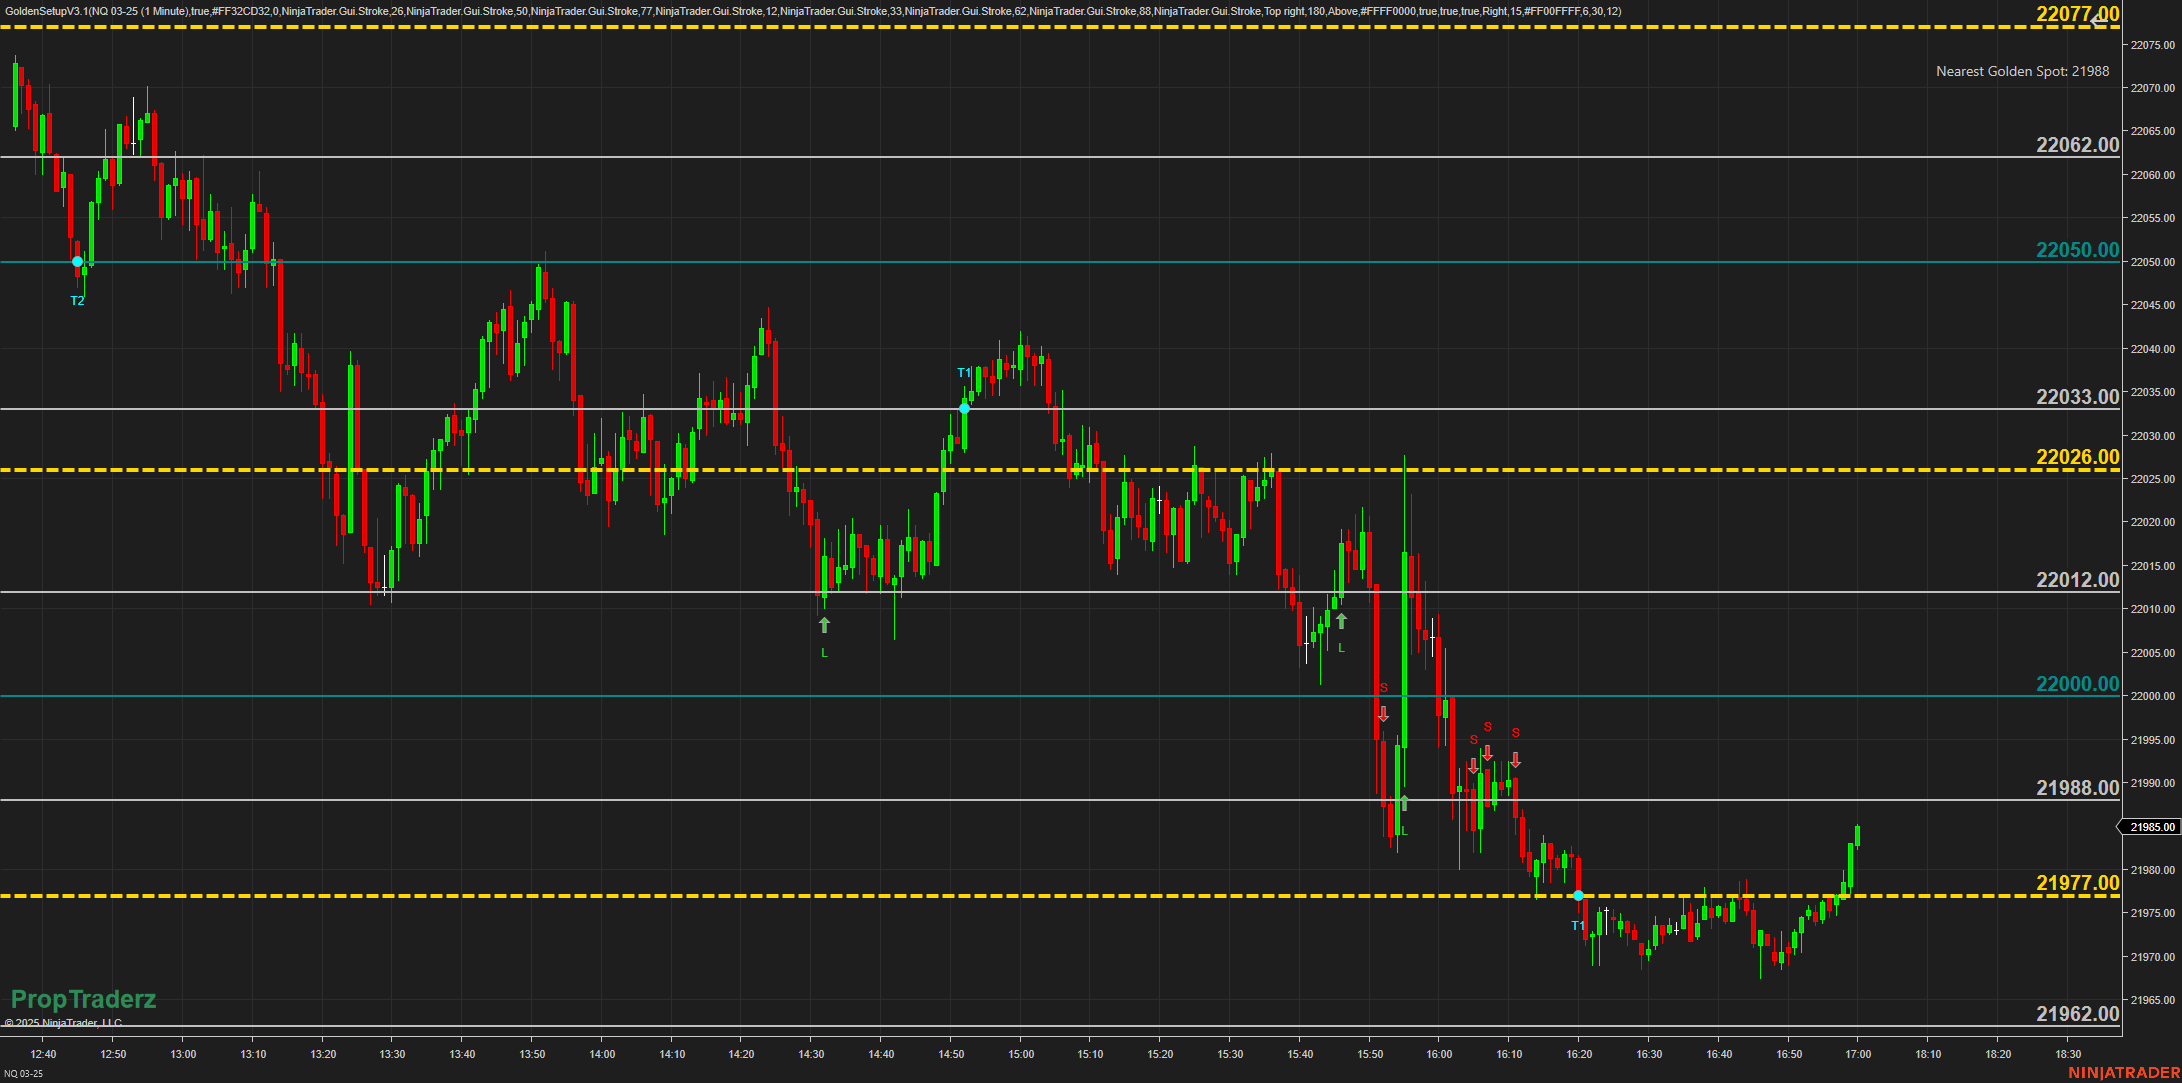
ATR VOLATILITY FILTER
ATR Volatility Filter Know When the Market Is Calm or Ready to Explode Volatility is the pulse of the market. When it beats fast, traders get opportunity — and risk. When it slows down, the game shifts toward patience and precision. Our new ATR Volatility Filter for NinjaTrader 8 gives you a simple, visual way to read that pulse directly on your chart. What It Does This lightweight indicator calculates the Average True Range (ATR) — the classic measure of market volatility — and displays a colored box on your chart showing the current ATR value and volatility state: Low Volatility — the market is quiet, ideal for scalpers or…
-
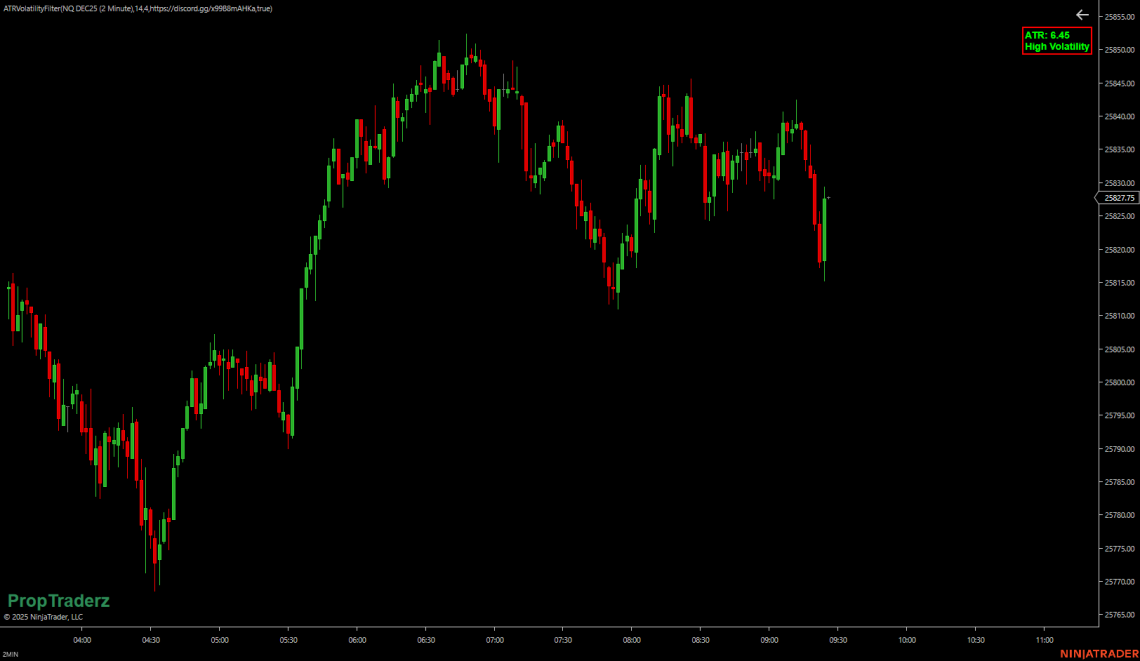
EMA CROSS SIGNALS
EMA Cross Signals NinjaTrader Indicator by PropTraderz At PropTraderz, we keep things practical — tools that actually help traders. The EMA Cross Arrows indicator was built for those who love simplicity and precision. It’s a lightweight yet powerful indicator that plots two customizable EMAs and draws up and down arrows every time they cross. Whether you’re scalping, day-trading, or swing-trading, EMA crosses remain one of the cleanest visual ways to track short-term momentum shifts. This indicator makes them crystal clear, so you can react quickly and confidently. Key Features Fully customizable EMA periods (set your own fast and slow values) Adjustable colors, line widths, and arrow sizes Alerts on crossover…
You May Also Like

Exploring Stochastic Oscillator-how to use Stochastic Oscillator
-
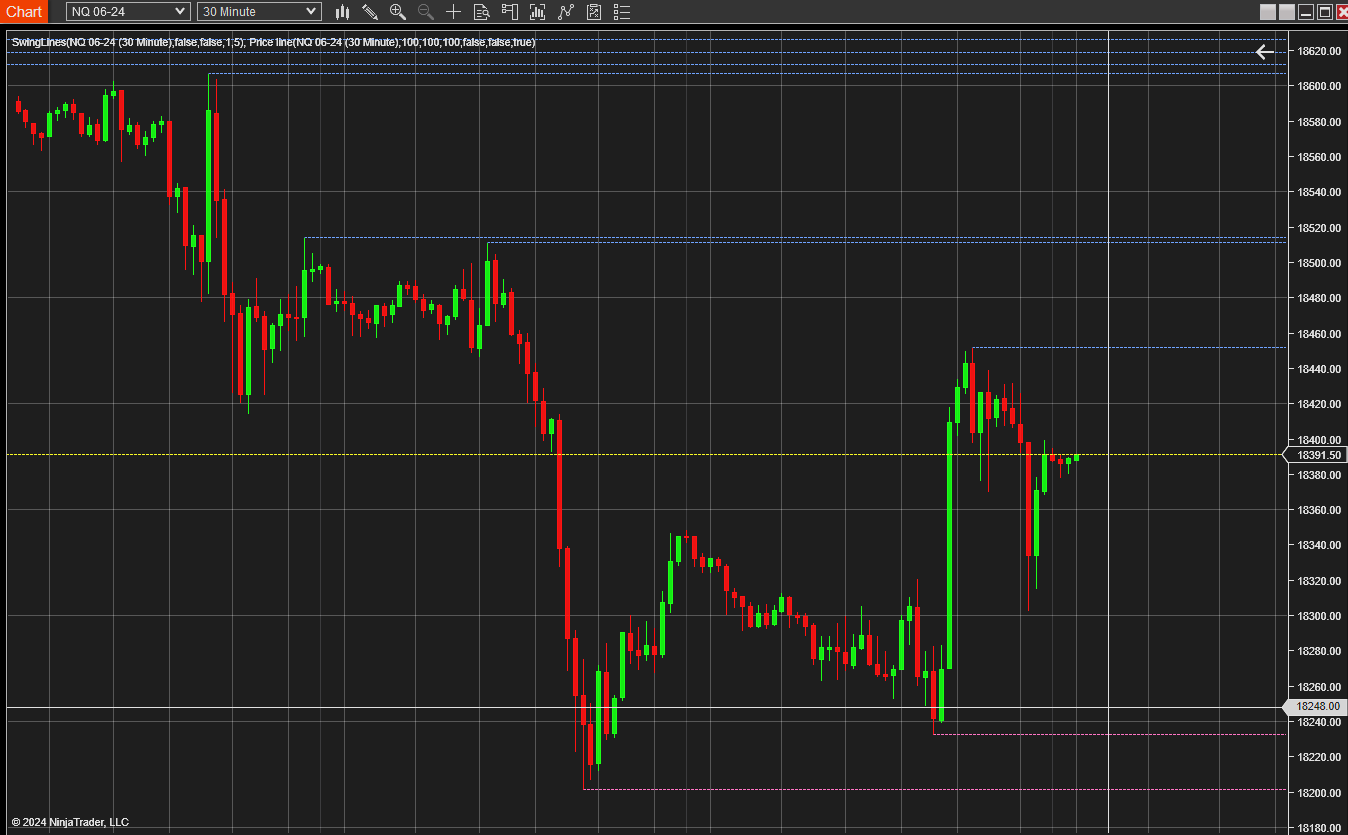
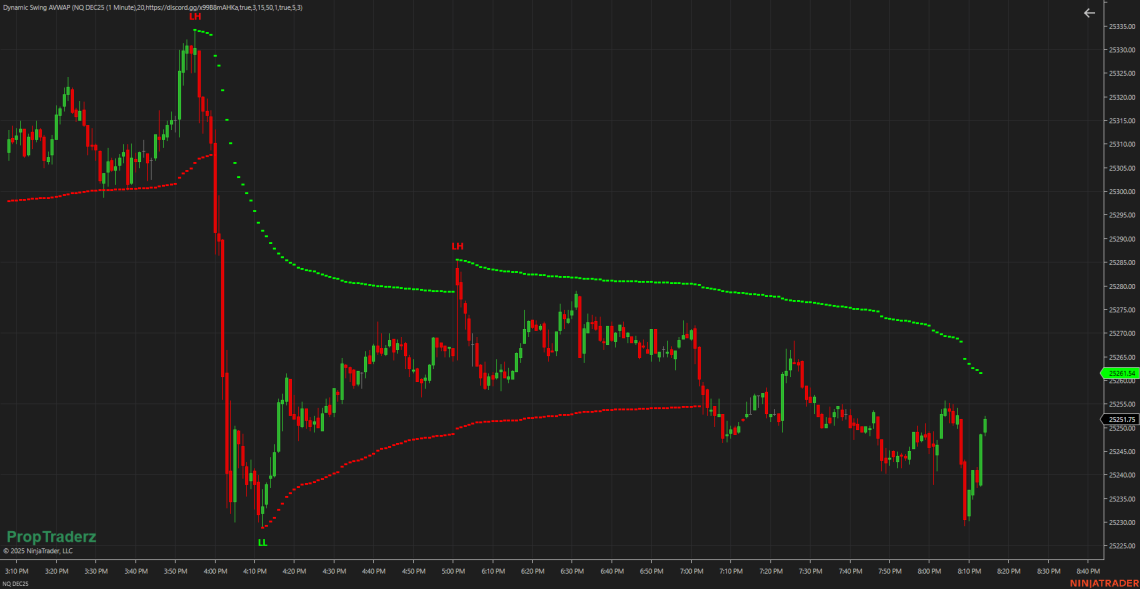
Dynamic Swing Anchored VWAP
The Idea – Dynamic Swing Anchored VWAP Markets move in legs, not straight lines. Every leg begins where the previous one failed — at a pivot. The Dynamic Swing Anchored VWAP maps that structure directly on your chart by resetting a VWAP (Volume-Weighted Average Price) from each confirmed swing high or swing low. Instead of a single running VWAP that smears trend changes, this version anchors locally — one calculation per leg — letting you see where real accumulation and distribution happen. It’s like watching institutions reload each swing. How It Works Each time price forms a new pivot (HH, HL, LH, LL), the indicator: Detects the swing using your…
-
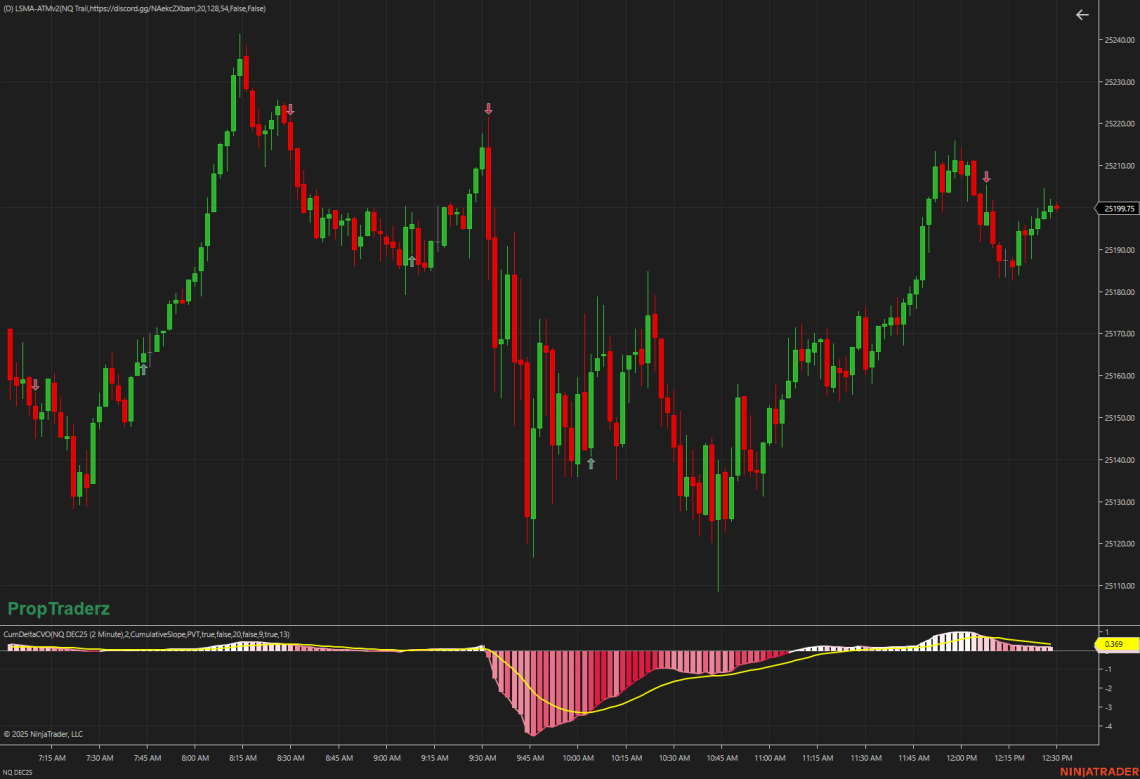
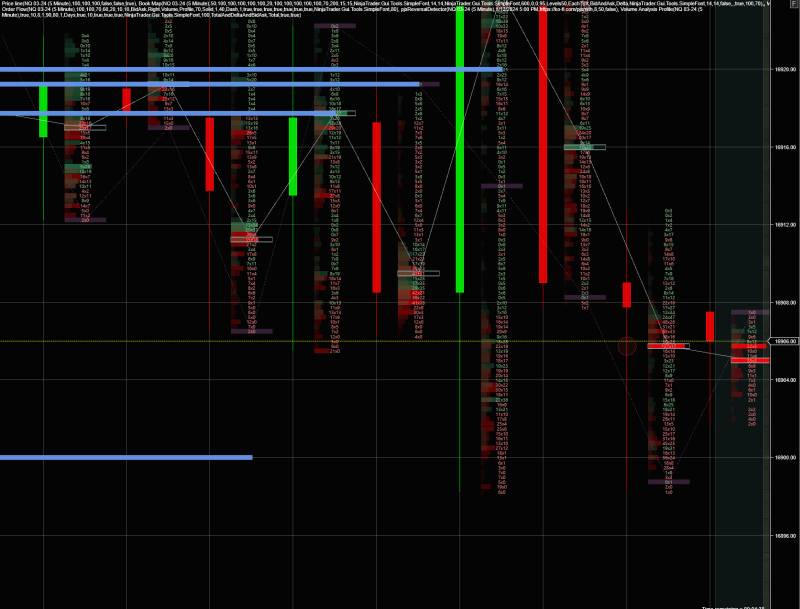
Cumulative Delta CVOV3
The PropTraderz Cumulative Delta CVOV3 Indicator brings together three powerful forms of volume analysis—OBV, CVD, and PVT—into a single dynamic tool. It translates raw volume data into a clear, actionable view of market participation, showing when aggressive buyers or sellers are dominating, and when pressure begins to shift. Designed for NinjaTrader 8, this indicator was inspired by cumulative delta methodologies originally developed by Igor Zeierman, and re-engineered by PropTraderz to offer flexible visualization, smarter normalization, and full bar-color integration. ⚙️ What It Does At its core, the CVO measures how volume flows through price movement. It helps traders understand who is in control of the market—buyers or sellers—and when…
-
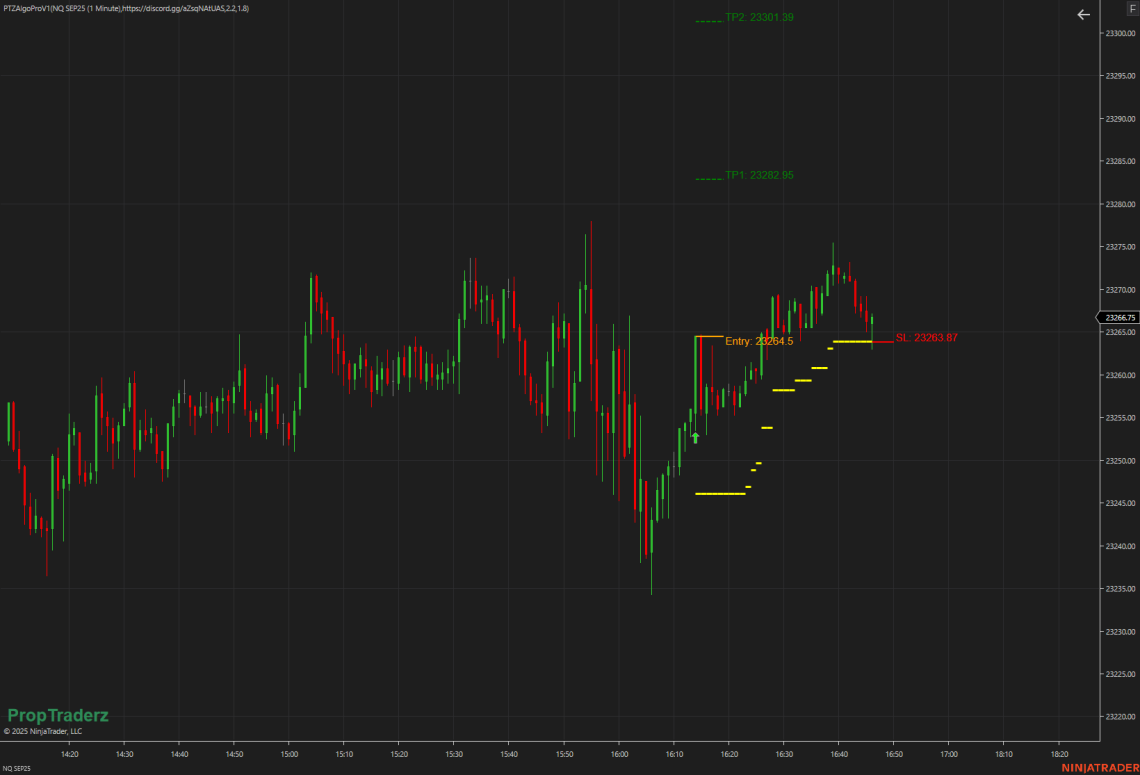
Algo ProV1
What It Does AlgoProV1 blends a tried‑and‑true SuperTrend trend filter with an ATR‑based stop‑loss that trails and plots clear profit targets—so you can focus on trading, not chart clutter. Trend Detection Computes a “SuperTrend” line by taking the average of high/low/close/open (HLCO) and offsetting it by ATR×Sensitivity. When price crosses above the upper band, a long signal is triggered; crossing below the lower band gives a short signal. Entry arrows mark the exact bar of the SuperTrend flip. Dynamic Stop‑Loss (SL) On entry, SL is set at entry ± ATR×SLFactor. As the trade progresses, the indicator recalculates ATR×SLFactor each bar. Only if this new level is more protective…
-
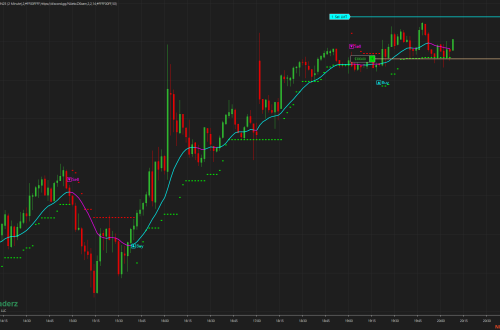
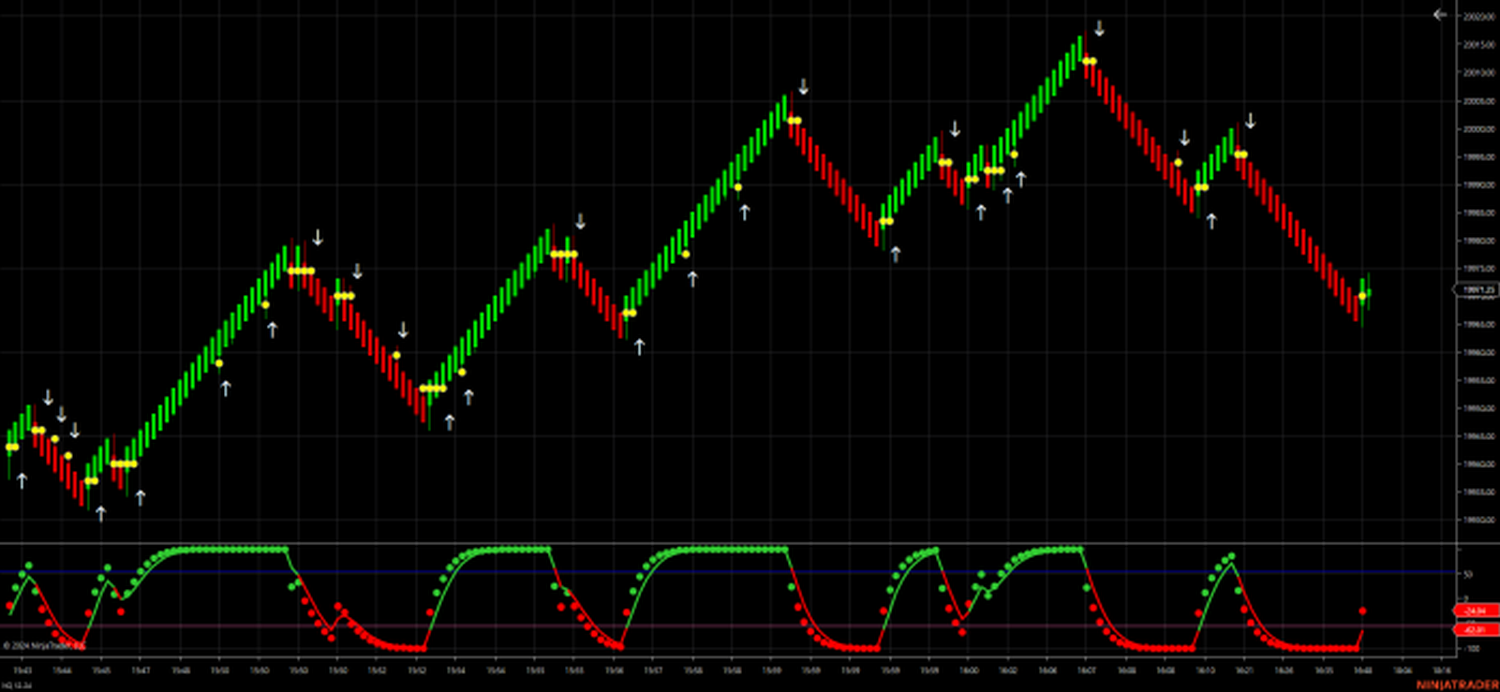
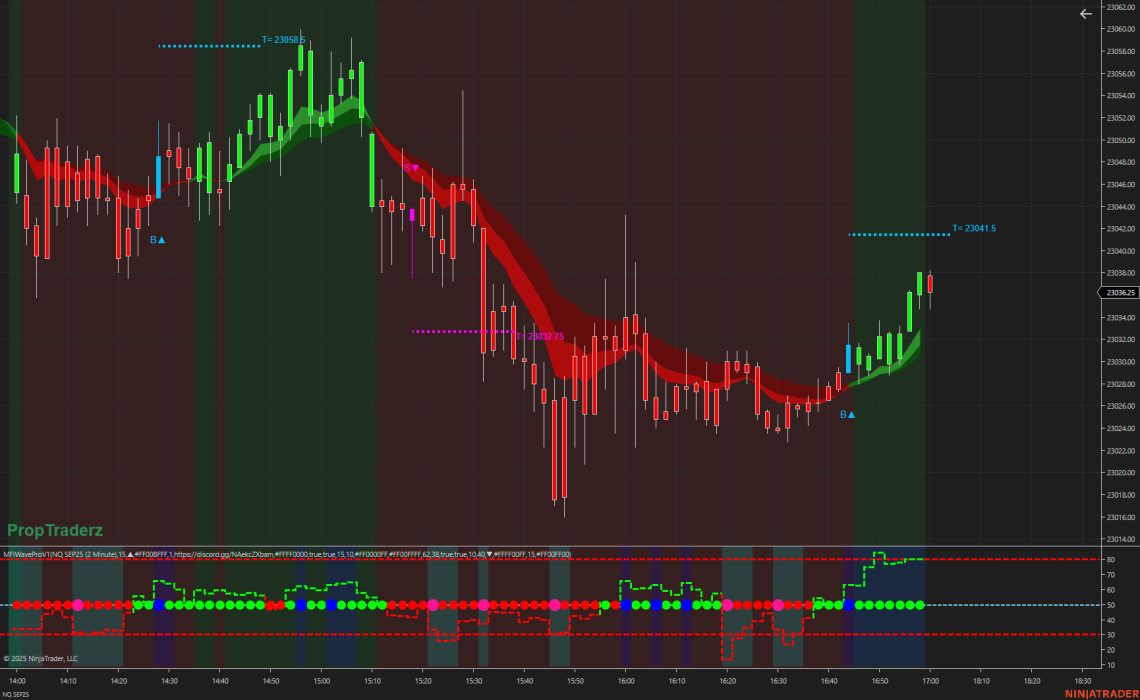
MFIWaveProV1 NinjaTrader8
Introducing MFIWaveProV1: The Ultimate Dual-Panel Signal Engine Ready to take your trading visuals and signal precision to the next level? Meet MFIWaveProV1, the PropTraderz powerhouse indicator that combines trend-filtering EMAs, advanced entry logic, and ProZone-style MFI shading into one seamless package. Why You’ll Love It Crystal-Clear Trend Detection An 8/13/21 EMA ribbon on your price chart, with customizable bull/bear region fills and opacity, instantly shows you the prevailing market bias. Precision Entries & Profit Targets Our ATR-based trend bands, DI chop filter and strict MFI thresholds work together to trigger “B▲” and “S▼” arrows when all conditions align. Each signal comes with a dotted profit‐target line and price label so…