-
Trade Timer Box
Free NinjaTrader Indicator Prop Firm Rule Awareness Micro-Scalping Monitor Trade Timer Box: Free NinjaTrader Indicator for Tracking Trade Duration and Micro-Scalping Risk Trade Timer Box is a free NinjaTrader indicator built to help traders monitor how long they stay in trades, track average hold time, and identify whether their trading behavior may conflict with common prop firm micro-scalping rules. View Features Why Trade Duration Matters Many traders focus only on entries, exits, targets, and drawdown. But in prop firm trading, trade duration can also matter. Some prop firms monitor very short-duration trades, especially when a large portion of total trades or gross winning profit comes from trades held only a…
-
Ptz Risk Manager
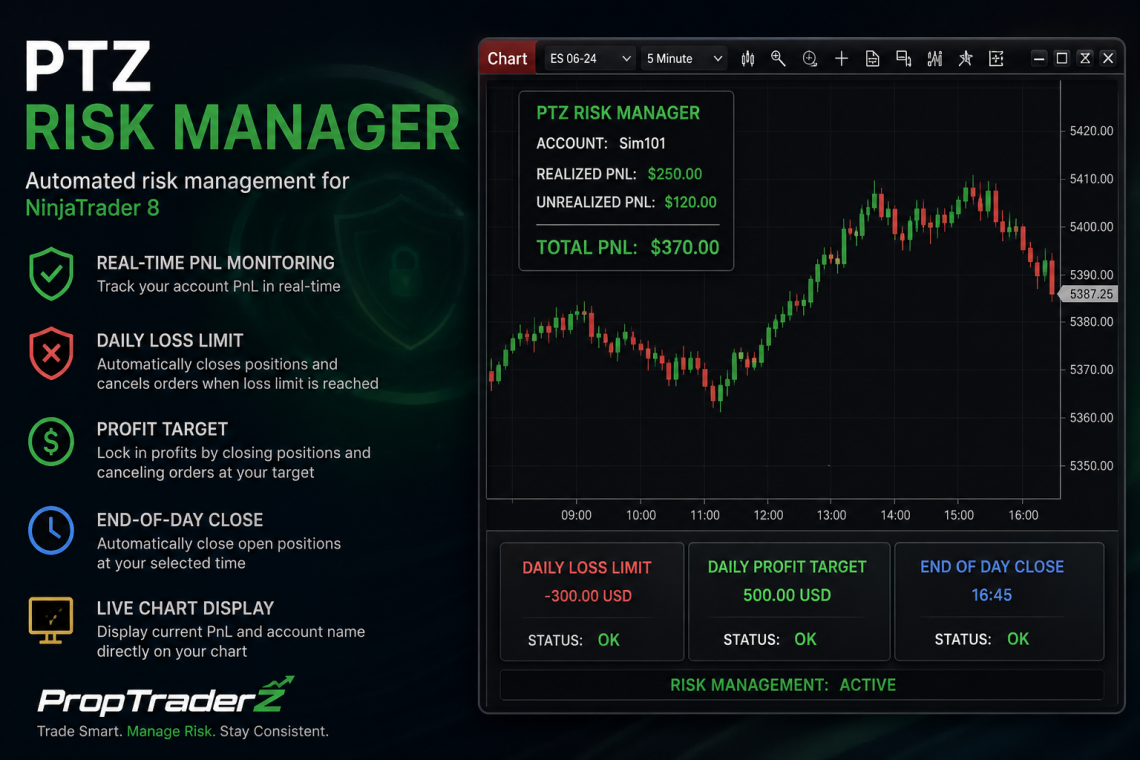
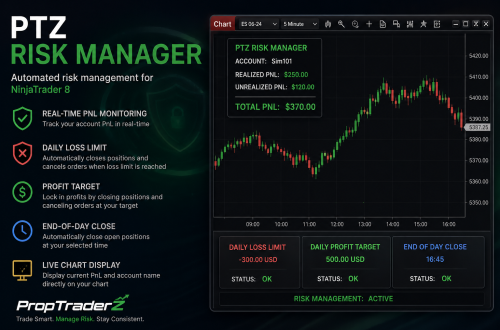
NinjaTrader 8 Indicator PTZ Risk Manager PTZ Risk Manager is a NinjaTrader 8 risk management indicator designed to monitor account PnL in real time and automatically protect your trading account when predefined profit, loss, or time-based limits are reached. Real-Time PnL Daily Loss Limit Profit Lock End-of-Day Close Download PTZ Risk Manager Add an extra layer of protection to your NinjaTrader 8 workflow and keep your trading risk under control. Account Protection Automatically closes open positions when your account reaches the selected daily loss limit or profit target. Order Control Cancels working orders when your risk parameters are triggered, helping prevent unwanted re-entry. Live Chart Display Displays current account PnL…
-
FloopPro
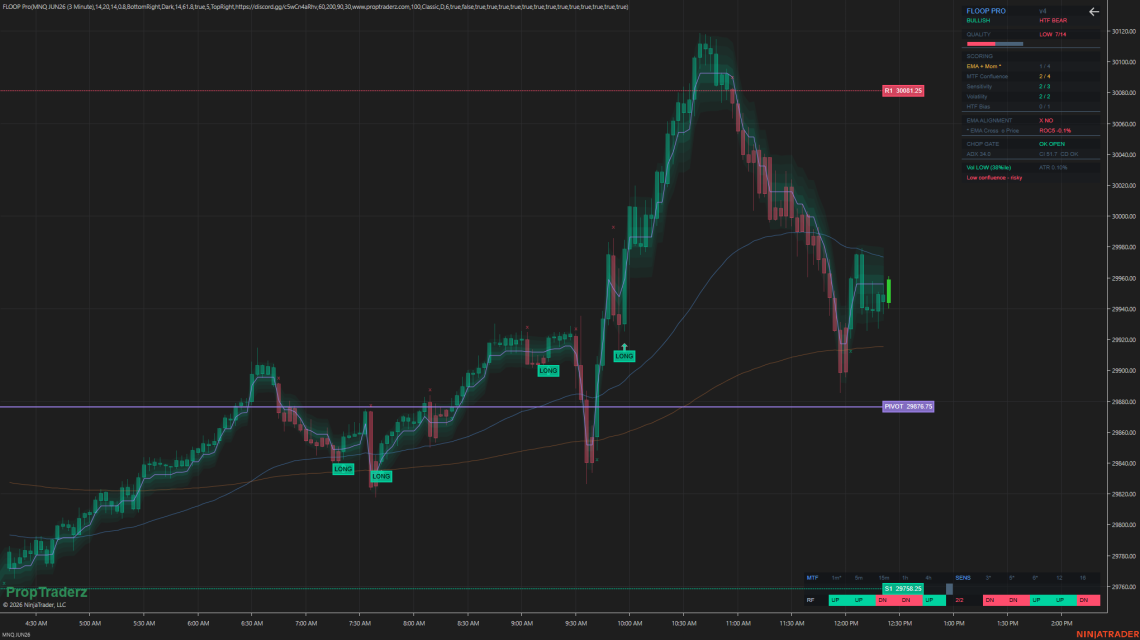
Free NinjaTrader 8 Indicator FLOOP Pro A free NinjaTrader 8 trend dashboard indicator with range filter, EMA alignment, pivot levels, MTF confirmation, signal quality scoring, trailing bands, ADX/chop filters and alerts. FloopPro Login / Register to Download Trend + Confirmation Tool What Is FLOOP Pro? FLOOP Pro is a chart-reading and confirmation tool for NinjaTrader 8. It combines a range filter, EMA alignment, volatility scoring, ADX/chop filtering, multi-timeframe trend checks, pivot levels, signal labels, trailing bands, alerts, and a compact dashboard to help traders evaluate market conditions more clearly. Range Filter Tracks trend direction using a range-filter style line and dynamic trailing bands. EMA Alignment Uses fast and slow EMA…
-
Liquidity Hunter
Get the free NinjaTrader 8 indicator and start using it on your charts. Liquidity Hunter Login / Register to Download Market Structure Tool What Liquidity Hunter Shows Liquidity Hunter is designed to help NinjaTrader 8 users visualize important liquidity areas, swing structure, previous high and low references, premium/discount zones, supply/demand areas, BOS/CHoCH structure shifts, order blocks, and FVG-style imbalance zones directly on the chart. Liquidity Zones Plots swing high and swing low liquidity areas with optional boxes, lines, and bubble markers. Market Structure Highlights HH, HL, LH, LL, Break of Structure, and Change of Character labels. Supply & Demand Displays premium and discount areas as potential supply/sell and demand/buy zones.…
-
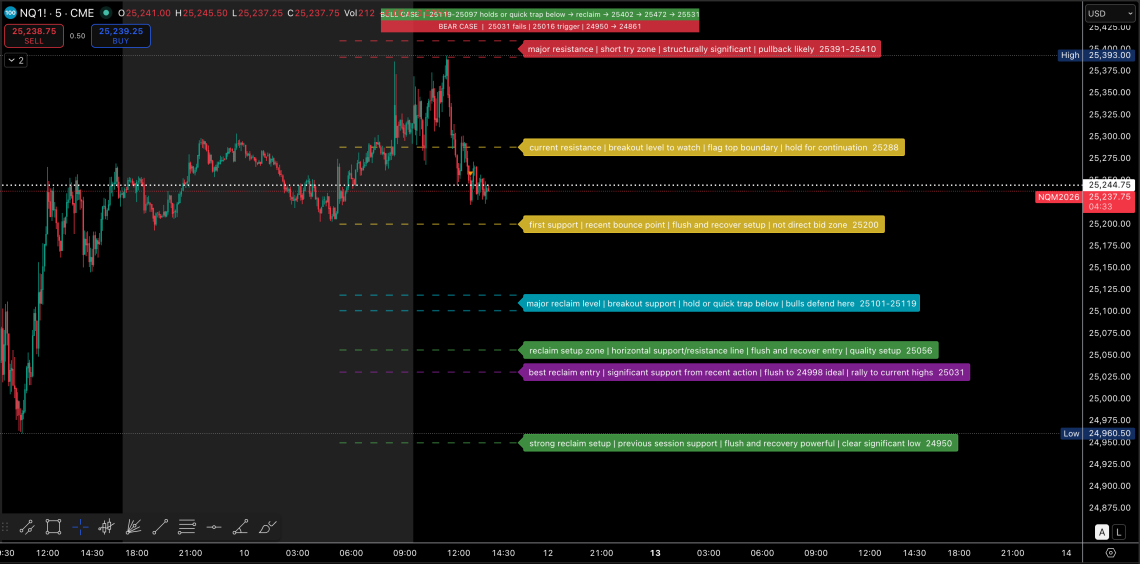
TradingView Trading Plan Indicator
📊 Trading Levels PTZ v2 — Free TradingView Indicator A fully customizable TradingView indicator that displays your daily trading plan levels directly on your chart — color-coded labels with built-in smart alerts. 👉 Get the Indicator on TradingView 🚀 What It Does Paste your trading levels in a simple format and the indicator draws clean, color-coded labels at each price level on the right side of your chart. No lines cluttering your price action — just the information you need, right where you need it. 🔴 Red — resistance / short try zones 🟢 Green — quality long entries (flush + reclaim) 🟣 Purple — best entries 🔵 Aqua —…
-
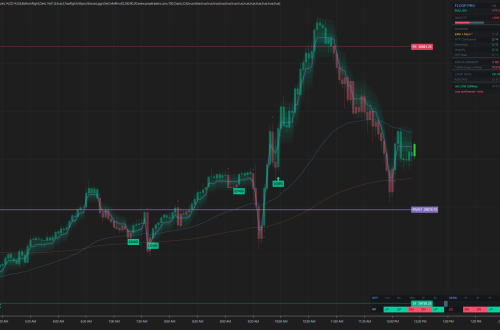
FlowMatriXFreePack
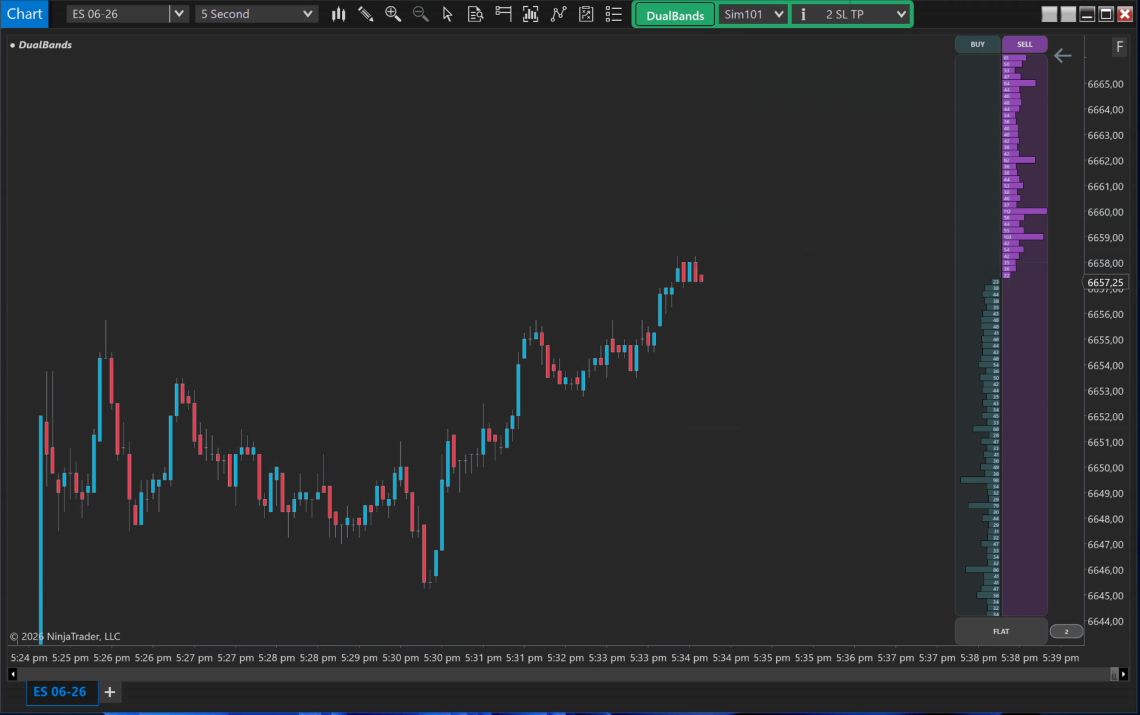
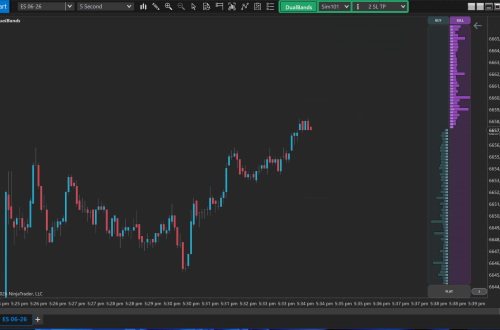
FlowMatrix Documentation here: https://www.flowmatrix-nt8.com/pages/documentation 📦 What’s Included 🔹 DualBands Buy & Sell bands — Visual bands on the chart showing where your orders will be placed. Click to submit instantly. Bid/Ask depth visualization — See the order book depth rendered as colored bands directly on price levels. Quick quantity presets — Switch between predefined lot sizes with one click (1, 2, 5, 10 or custom). Real-time PnL — Your profit and loss updates live on the chart as price moves. One-click position management — Flatten or reverse your position with a single button. 👉 Tutorial and Documentation here: https://www.flowmatrix-nt8.com/pages/blog/dualbands-tutorial-trade-from-your-chart.html 🔹 TapeReader – Sweep DetectionAutomatic detection of directional sweeps and absorptions that signal the intent of…
-
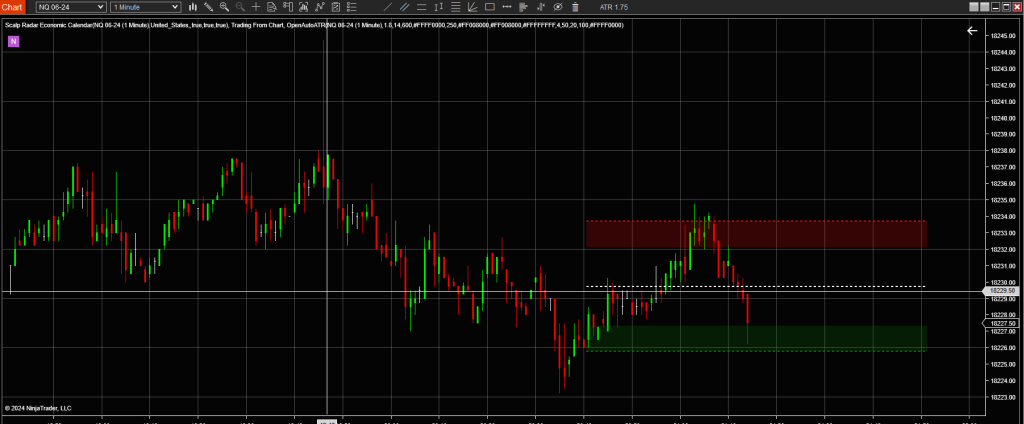
News Alerts Indicator
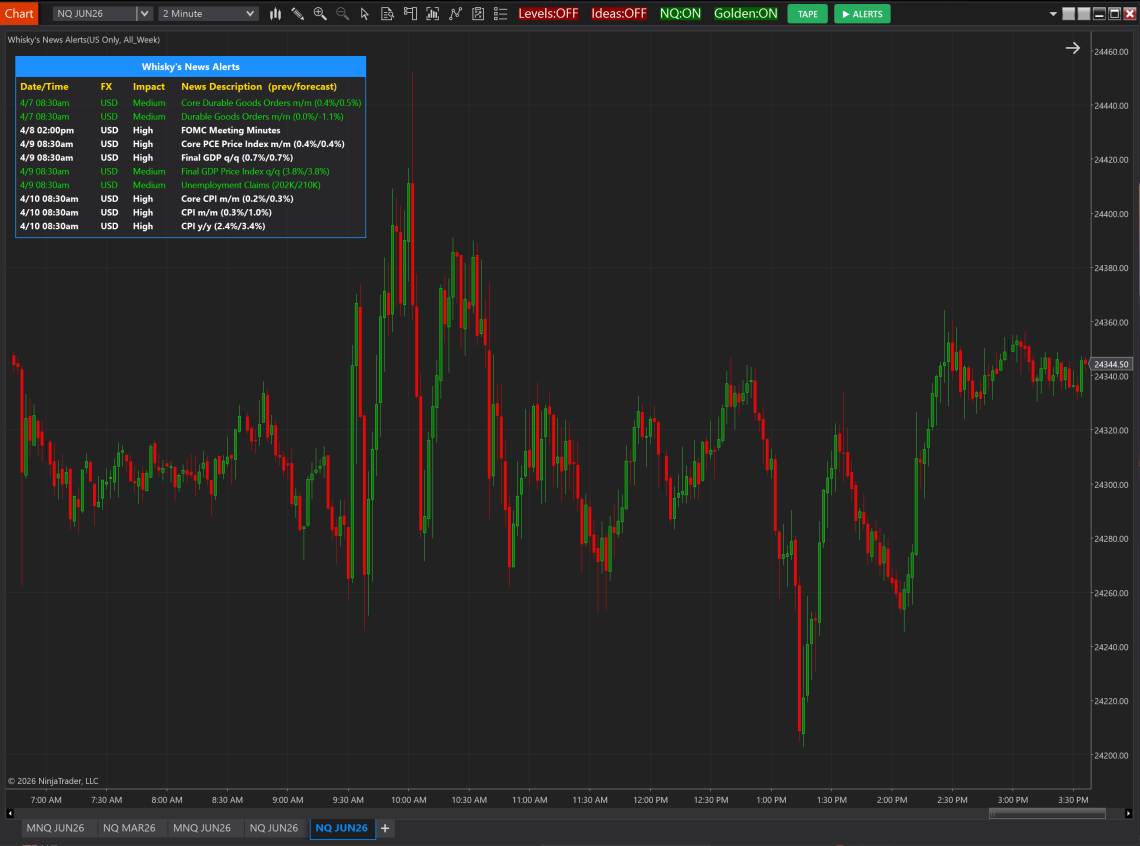
Whiskey’s News Alerts – NinjaTrader Indicator Whiskey’s News Alerts is a NinjaTrader indicator that displays real-time economic news directly on your chart, helping traders stay aware of high-impact events without leaving their platform. The indicator includes flexible filtering options, allowing you to select the time range (next 24 hours or full week), limit events to U.S. data only, and choose the importance level (high, medium, or all). This ensures you only see relevant information for your trading. Built-in alerts notify you ahead of key events, with customizable timing and sound, making it easier to prepare for high-impact releases such as CPI, PPI, and FOMC. The news panel is fully movable…
-
MGI LEVELS
Levels indicator (market generated information) plots all the key price references you need automatically — previous day, week, and month highs, lows, opens, closes, VAH, VAL, POC, Initial Balance and Overnight levels — all directly on your NinjaTrader chart. Every level has its own toggle so you see exactly what you want, nothing more. Clean chart, zero manual work, every session. Built for serious futures traders who trade ES, NQ and other CME products and want their key levels ready before the open — not after. Includes: Previous Day / Week / Month: High, Low, Open, Close, VAH, VAL, POC Initial Balance: High, Low, Mid Overnight: High, Low Day Open,…
-
PIVOT PROFILES
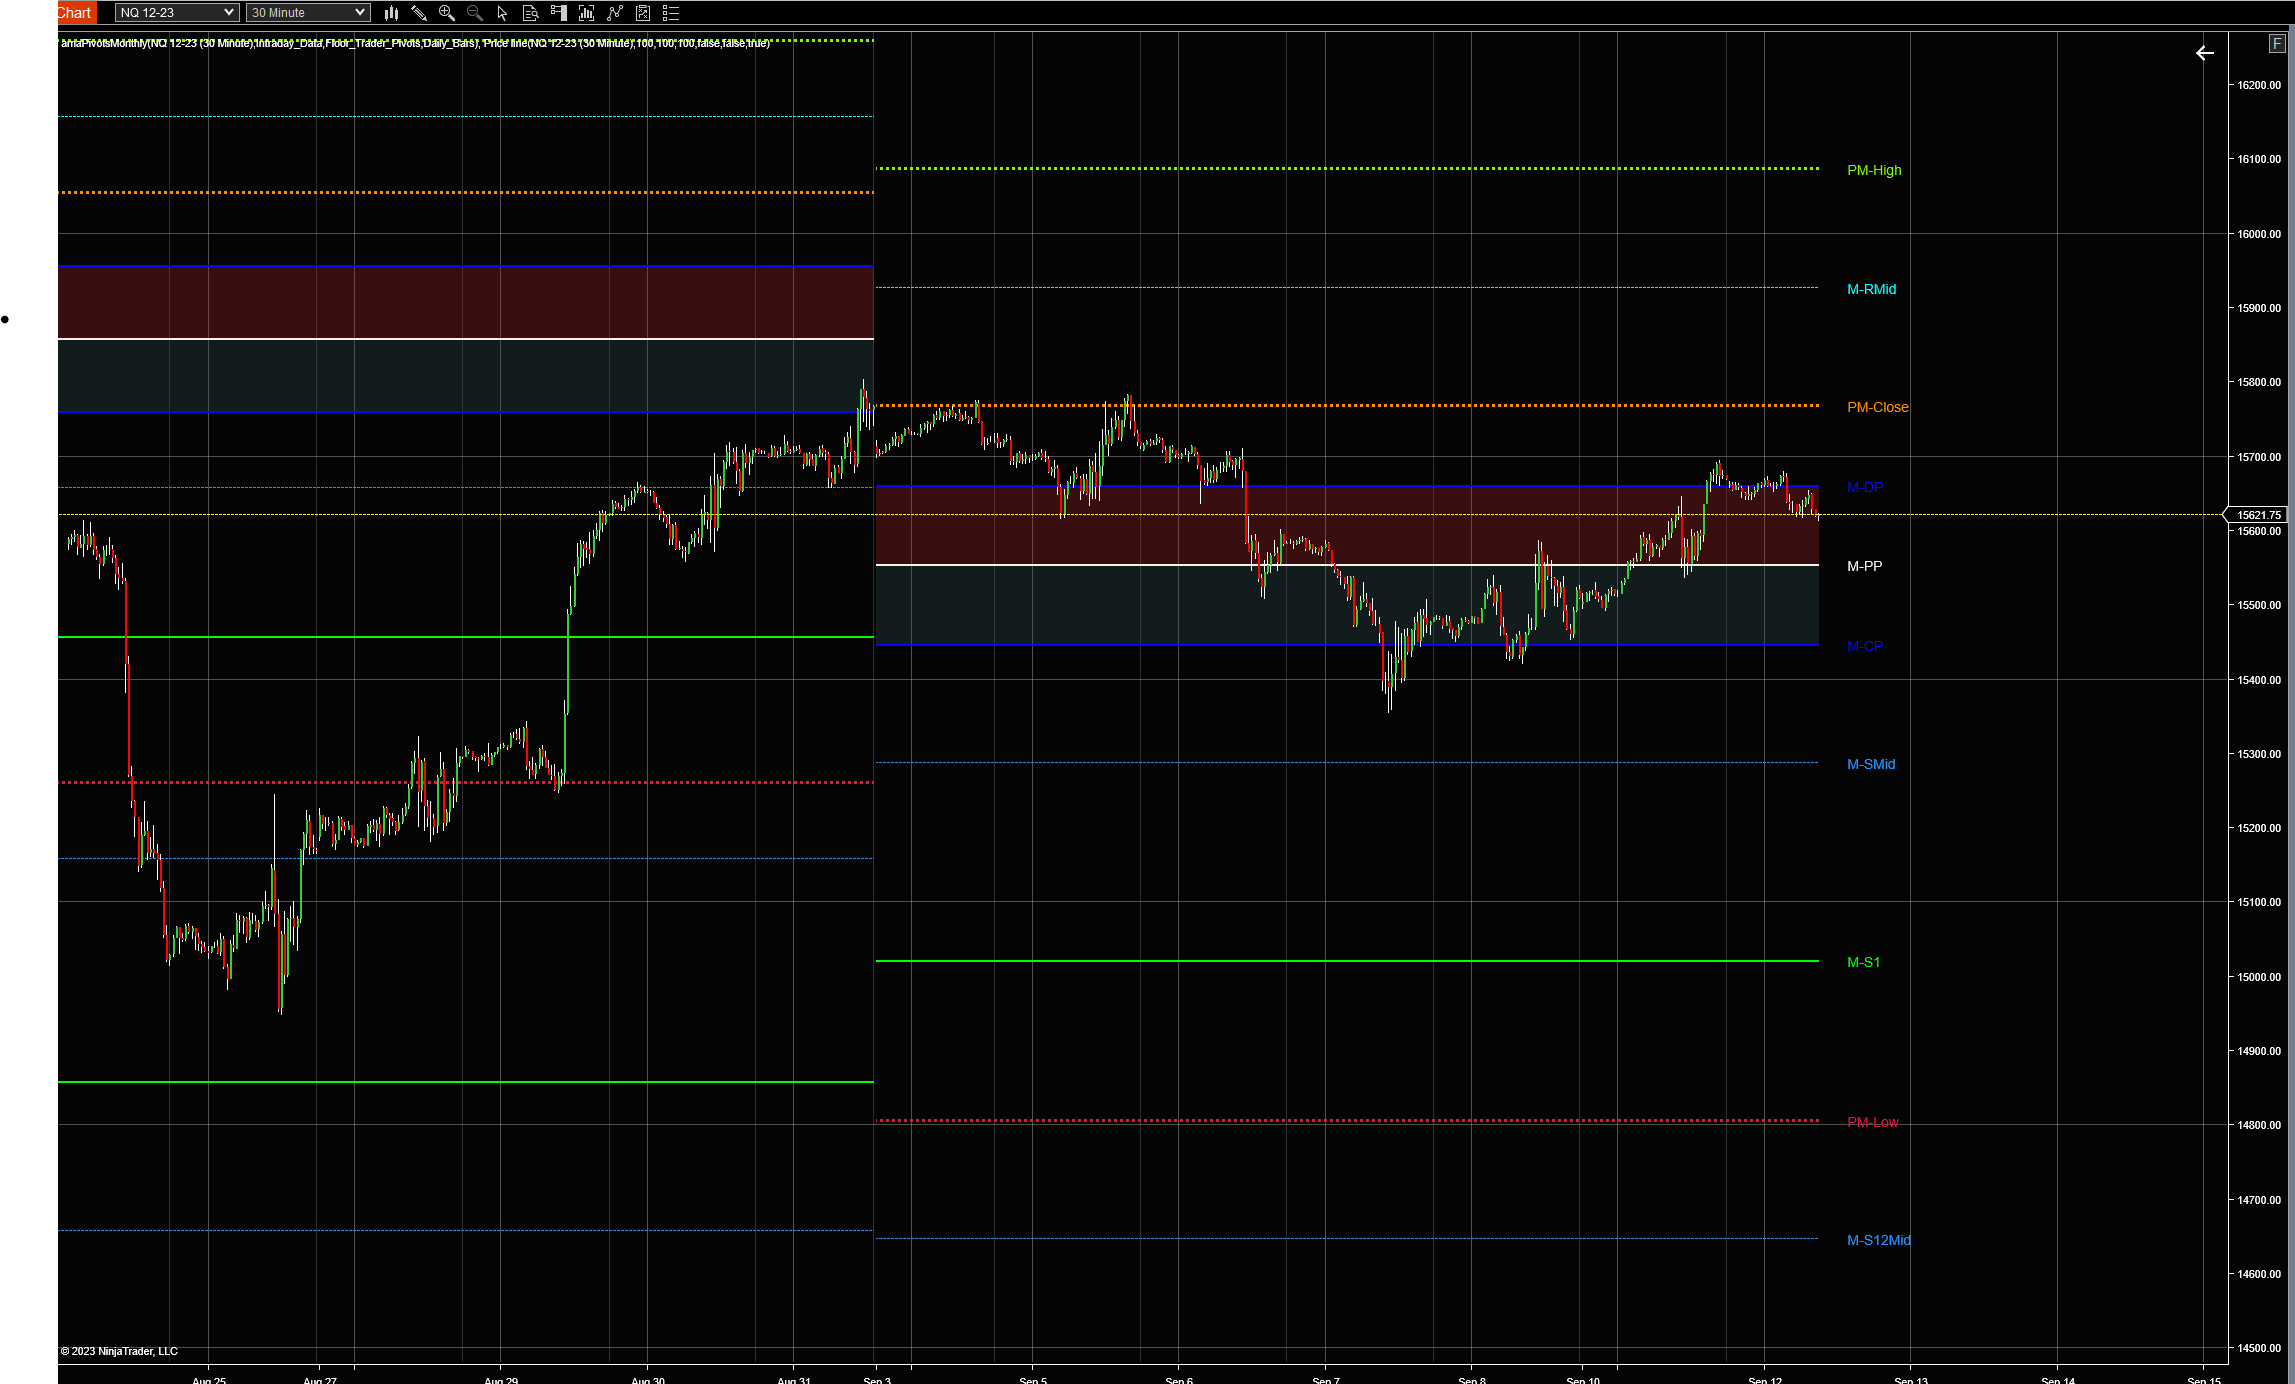
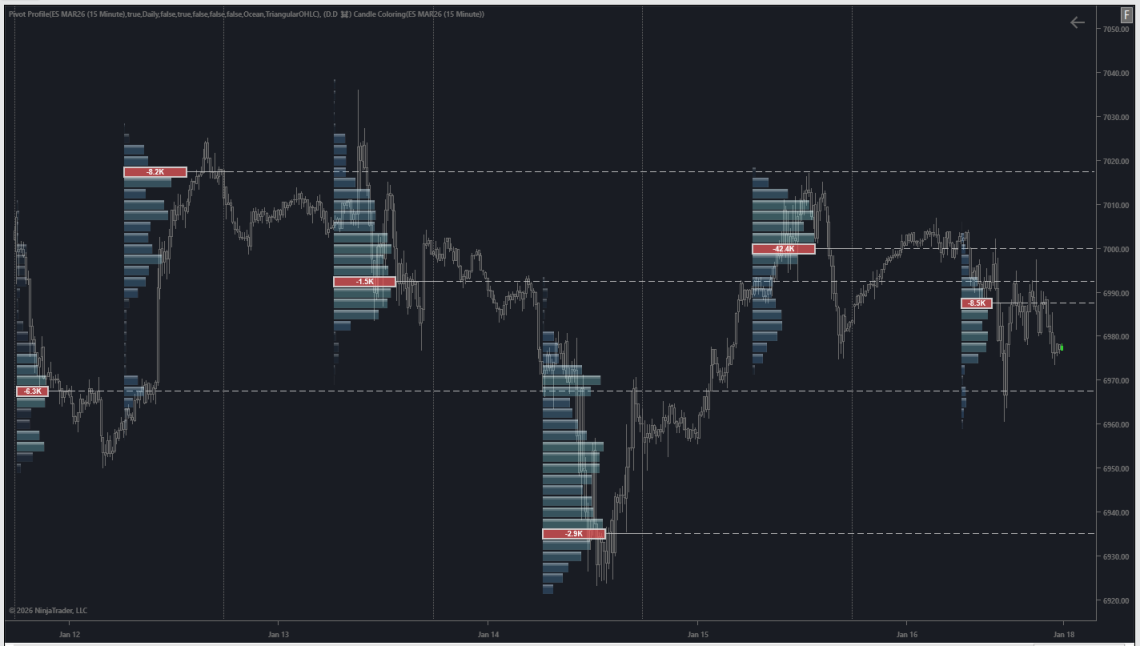
Indicator made by Dr. Doom Pivot / TPO Profiles – Advanced Structure View The Pivot Profiles indicator for NinjaTrader combines session-based volume profiles with auction structure analysis, offering a precise view of POC, Value Area, Initial Balance (IB), and VWAP across daily, weekly, or custom sessions. Multiple volume calculation modes are supported: EvenSplit – neutral distribution for clean structure analysis CloseWeighted – emphasizes acceptance near closing prices Triangular OHLC – approximates time/price participation within each bar Volume at Price (VAP) – tick-accurate volume distribution for detailed profiling The indicator highlights single prints, excess, balance vs. imbalance, and key inflection zones, making it suitable for context-driven execution, rotations, and Failed Breakdown logic,…
-
TPO Profiles Indicator for NinjaTrader
Indicator made by Dr. Doom More about TPO here About the TPO Profiles Indicator The TPO Profiles indicator for NinjaTrader is designed to visualize market structure and auction behavior using Time Price Opportunity (TPO) analysis. This indicator supports custom sessions, including daily, weekly, and session-based profiles, allowing traders to analyze structure across multiple time horizons. It highlights key auction concepts such as value areas, balance vs. imbalance, and directional intent. Key features include: Daily, weekly, and custom session TPO profiles Single prints for identifying excess, initiative activity, and potential repair zones Clear visualization of market structure, helping distinguish acceptance from rejection Flexible configuration to adapt to different markets and trading…