S
Indicators starting with S
-
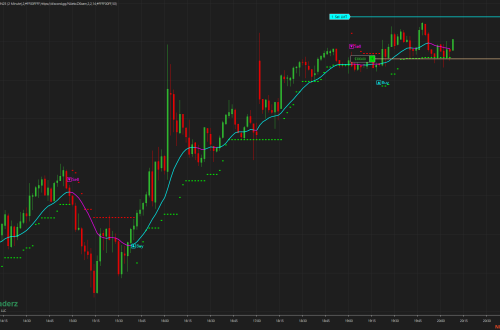
SuperTrendATM -AutoTrader
SuperTrend ATM Strategy Guide for NinjaTrader 8 Welcome to the official overview of the SuperTrendATM strategy coded by PropTraderz. This automated trading tool is designed to simplify execution using ATM (Advanced Trade Management) templates while leveraging the power of SuperTrend logic for directional bias. Whether you’re new to automation or a seasoned trader, this guide will help you understand how the strategy works and how to best use it in your trading workflow. 🗂️ The zip pack below contains: test strategy for use in strategy analyzer the atm strategy(can be tested only in live or market replay) Risk Account Manager (this will help flatten account when the profit target or…
-
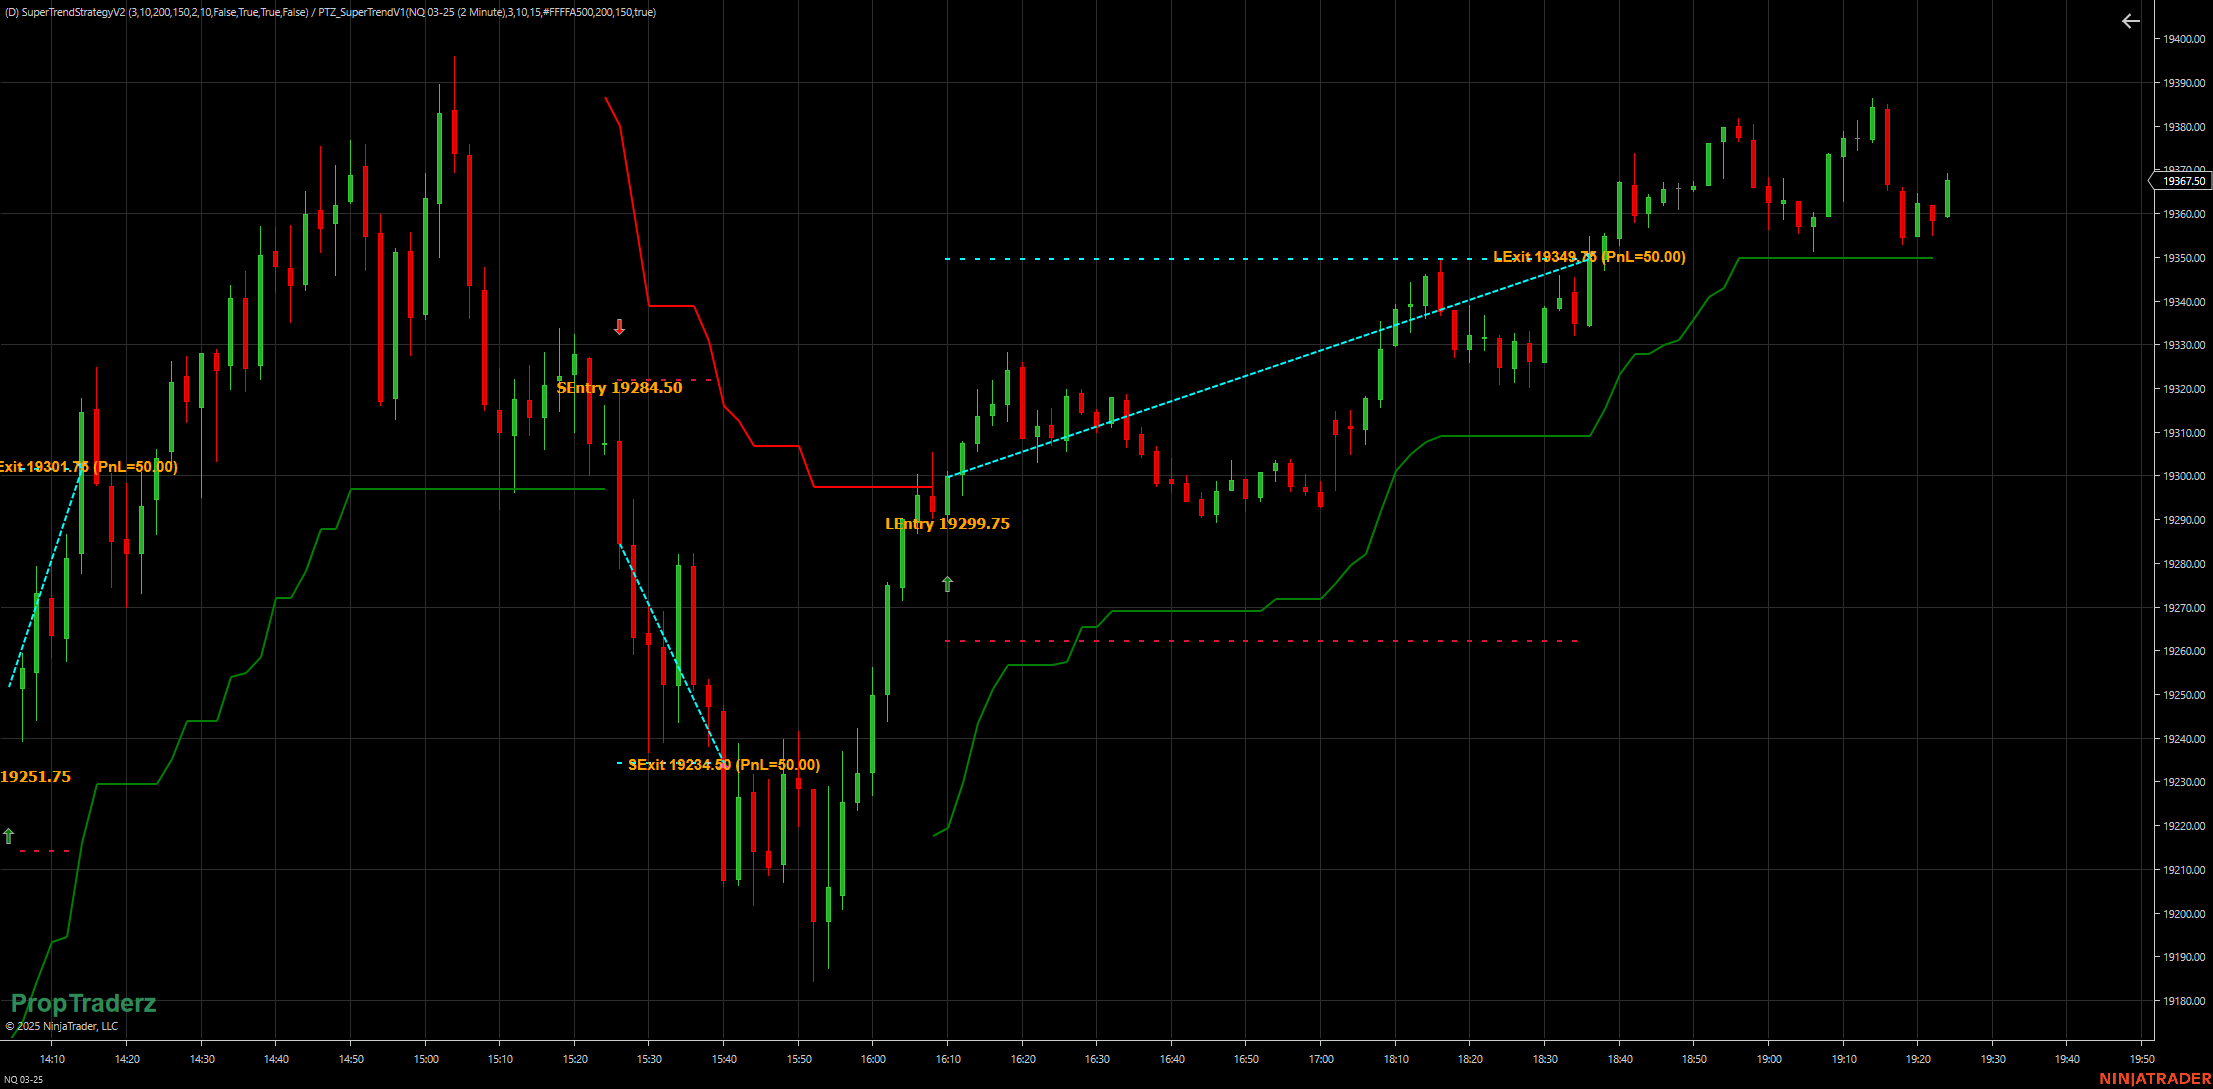
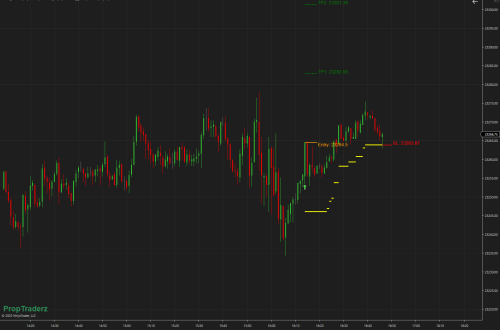
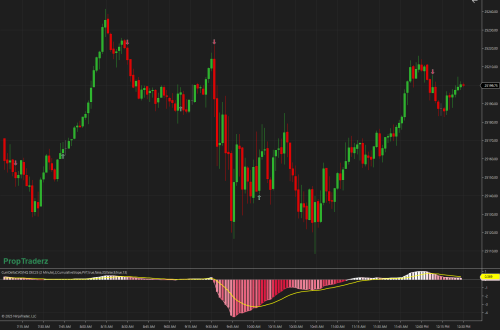
PTZ SUPER TREND V2 AUTOTRADER ATR
PTZ SUPER TREND V2 AUTOTRADER ATR with Multiple Stop & Target Options A Complete Guide to Using SuperTrend with Fixed, ATR-Based, and Trailing Stops Introduction The PTZ SUPER TREND V2 AUTOTRADER ATR is a widely used trend-following approach that helps traders identify potential entry and exit points based on price movements and volatility. Our PTZ SUPER TREND V2 AUTOTRADER ATR, developed by PropTraderz, enhances the traditional SuperTrend indicator by integrating multiple stop-loss and profit target methods, allowing users to fine-tune their risk management. This guide will walk you through the mechanics of the strategy, how signals are generated, and how to effectively use the three different stop & target methods…
-
Second Entry V2_2 -PATS
Second Entry V2_2 PAT Detection The indicator tracks market structure and identifies when the market has made a two-legged move in either direction. It marks the second entry long (2EL) below price bars in an uptrend and the second entry short (2ES) above price bars in a downtrend. ✅ Customizable Entry Signals Leg Count Tracking: Identifies each leg of the move and only signals when the second leg forms. Customizable Risk Management: Set your target, stop-loss placement, and signal distance for optimized trade execution. Dynamic Signal Placement: Allows users to swap long and short entries for better visibility. ✅ Visual & Audio Alerts Arrows & Text Labels: Clearly displays second-entry…
-
Scalp Trader MACD
The Scalp Trader MACD is an indicator designed for scalping. It also work for UniRenko, tick charts, and other bar types. Some UniRenko size are 32/80/160 Free Download Key Features: Dynamic No-Trade Zone Highlighting: Easily visualize out-of-session areas with customizable opacity, ensuring a clear distinction between active and inactive trading periods. Customizable Trade Filters: Refine your entries and exits using EMA and StepMA filters, designed to align with market trends and price action. Setup Flexibility: Configure stop-loss and profit target levels in ticks, giving you full control over your risk and reward. Monitor trade setups directly on the chart, including visual representations of stops and targets. Customizable signals,…
-
Sith Zeff Scalper Indicator
Sith Zeff Scalper Indicator Apex Trader Funding 80% OFF code PROPTRADERZ. 150K acc for 50$ after the discount and 85$ activation Fee The Sith Zeff Scalper Indicator isn’t just an indicator—it’s a comprehensive scalping strategy designed to capitalize on short-term market volatility. Whether you’re trading the Nasdaq (NQ) or other high ATR markets, this strategy helps you filter out market noise and focus on high-probability setups. Let’s break down the key components of the strategy, so you can fully understand how it works and apply it to your trading. Watch the video below to learn how to use it Core Elements of the Strategy The Sith Zeff Scalper focuses on…
-
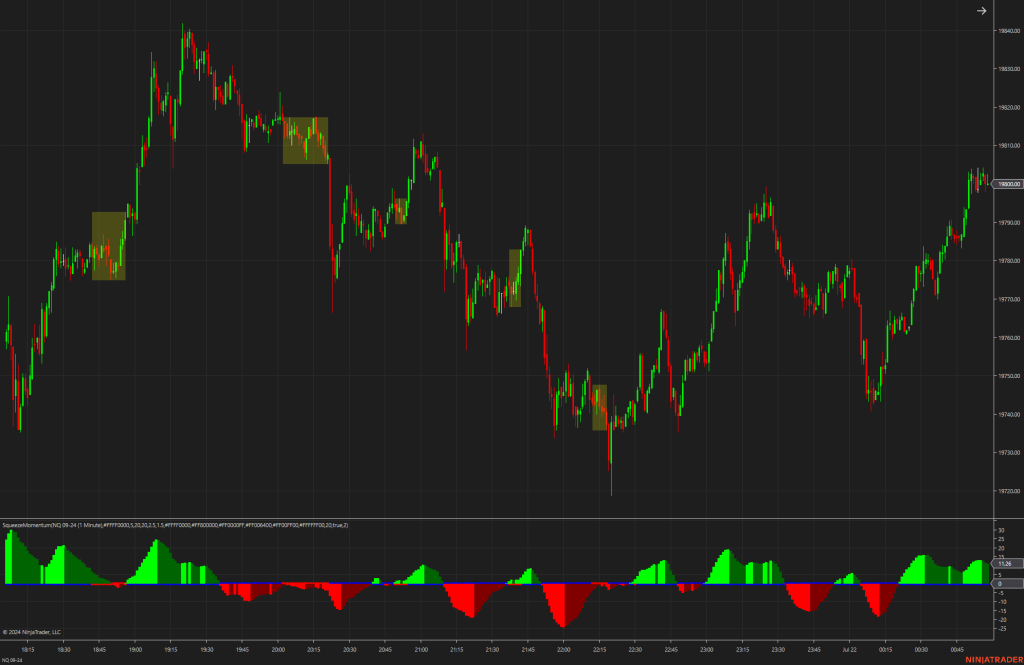
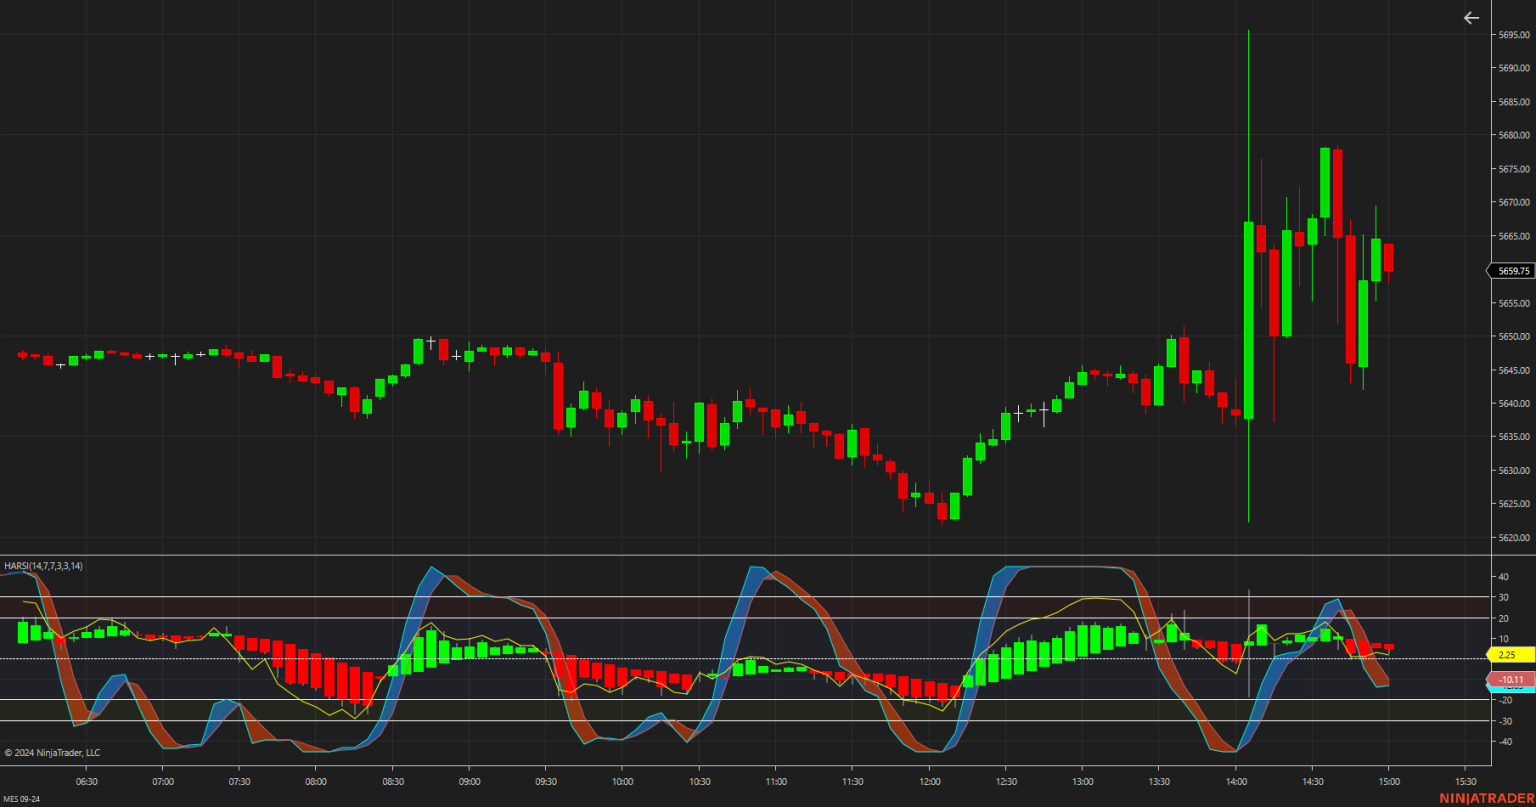
Squeeze Momentum
The Squeeze Momentum indicator is a tool that aims to help traders spot and capitalize on market “squeeze” situations, which often precede significant price movements. It uses a combination of Average True Range (ATR) and standard deviation calculations to identify when the market is in a squeeze—indicated by a period of lower volatility—and prepares traders for potential breakouts. With customizable settings for visual alerts and volatility boxes, it enhances the charting experience by highlighting crucial trading ranges. This indicator is suitable for traders who follow the Bollinger Bands and Keltner Channels strategies and are looking for a visual edge in their trading setup.
-
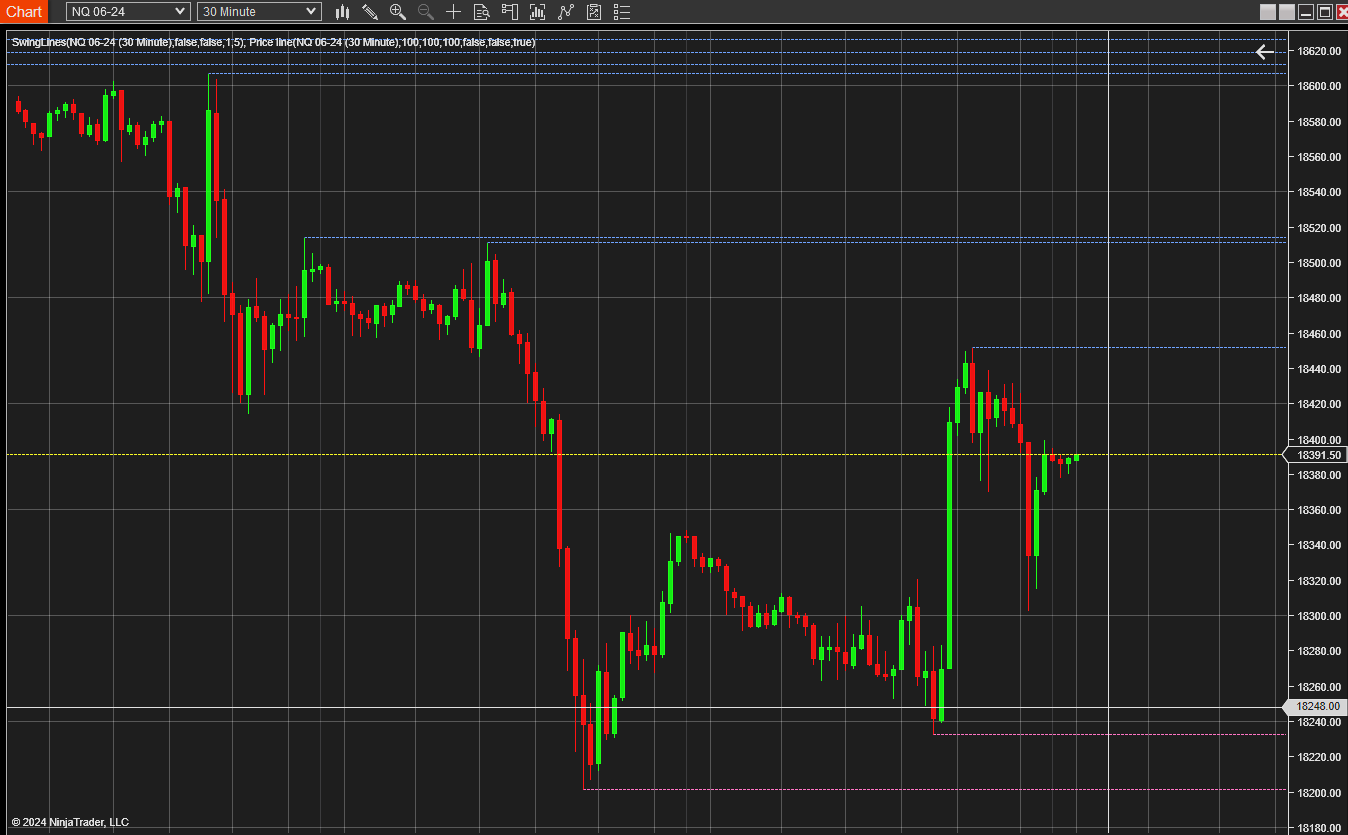
Swing Lines Add-on for NinjaTrader8
The Swing Lines Add-on for NinjaTrader8 plots lines extending from swing points to the right edge of the chart and will issue alerts when price crosses these lines. There is also an option to retain these lines after they’ve been breached by the price. Be aware that enabling the “keep broken lines” feature can result in numerous lines being drawn on the chart; therefore, it is turned off by default for clarity. With the Swing Lines Add-on for NinjaTrader8 you have the flexibility to customize the color of the swing lines and the alert sounds to suit your preferences. Both visual and audio alerts can be activated to notify you…
-
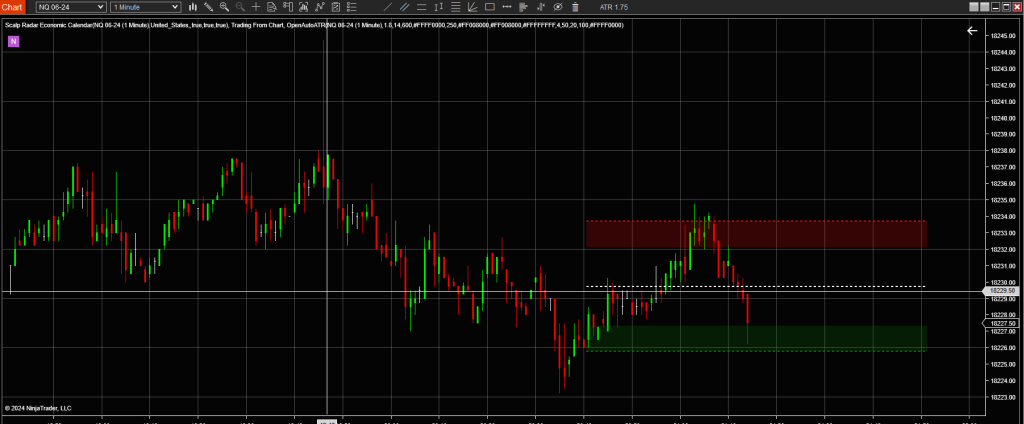
Supply Demand Zones for NT8
Supply Demand Zones for NT8 add-on plots supply and demand-based zones from various time frames on the chart. It also adds a context menu item to the default Ninja Trader context menu to hide and show active and broken zones. You can add the indicator multiple times on a chart and select different time frames for the supply-demand zone. Can customize color for each time frame so will know what TF that zone is plotting Supply Demand Zones for NT8
-
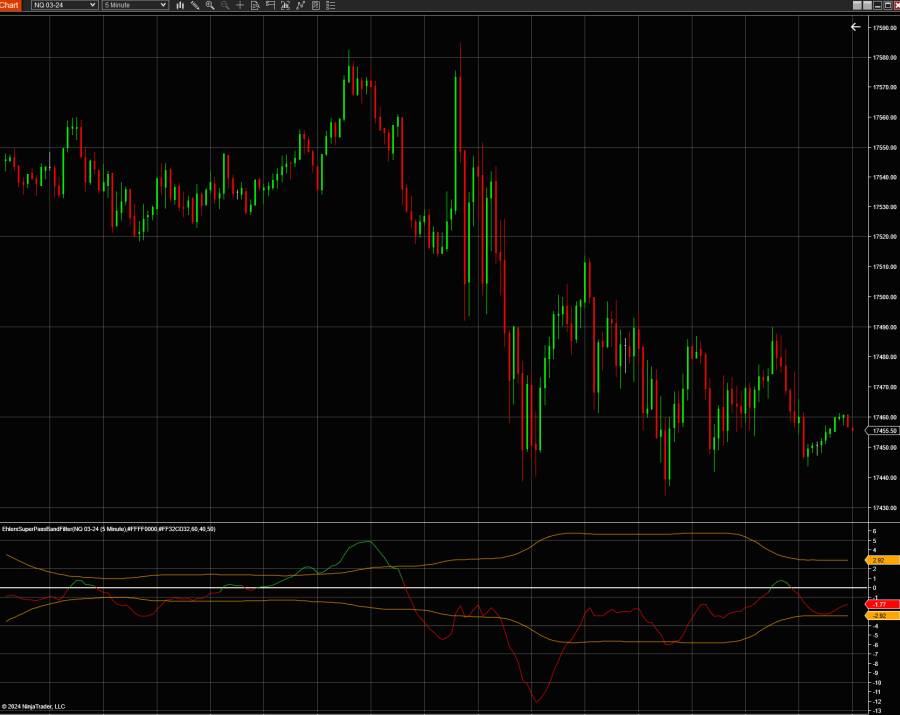
Super Passband Filter
Description The Super Passband Filter is a smoothing technique based on analogue filters. Its main purpose is to filter out unnecessary cycle data and reduce the output lag that many smoothing techniques are prone to. The smoothed and lag-reduced data is represented by the study’s main plot, SuperPassbandFilter. It is calculated as the difference of two exponential moving averages, z-transformed. Signals may be recognized using two reference plots: +RMS and -RMS, calculated as the root mean square of the main plot values. -RMS is +RMS times -1. According to this study Super Passband Filter, an entry signal can be recognized when the main plot crosses above the -RMS; crossing below…
-
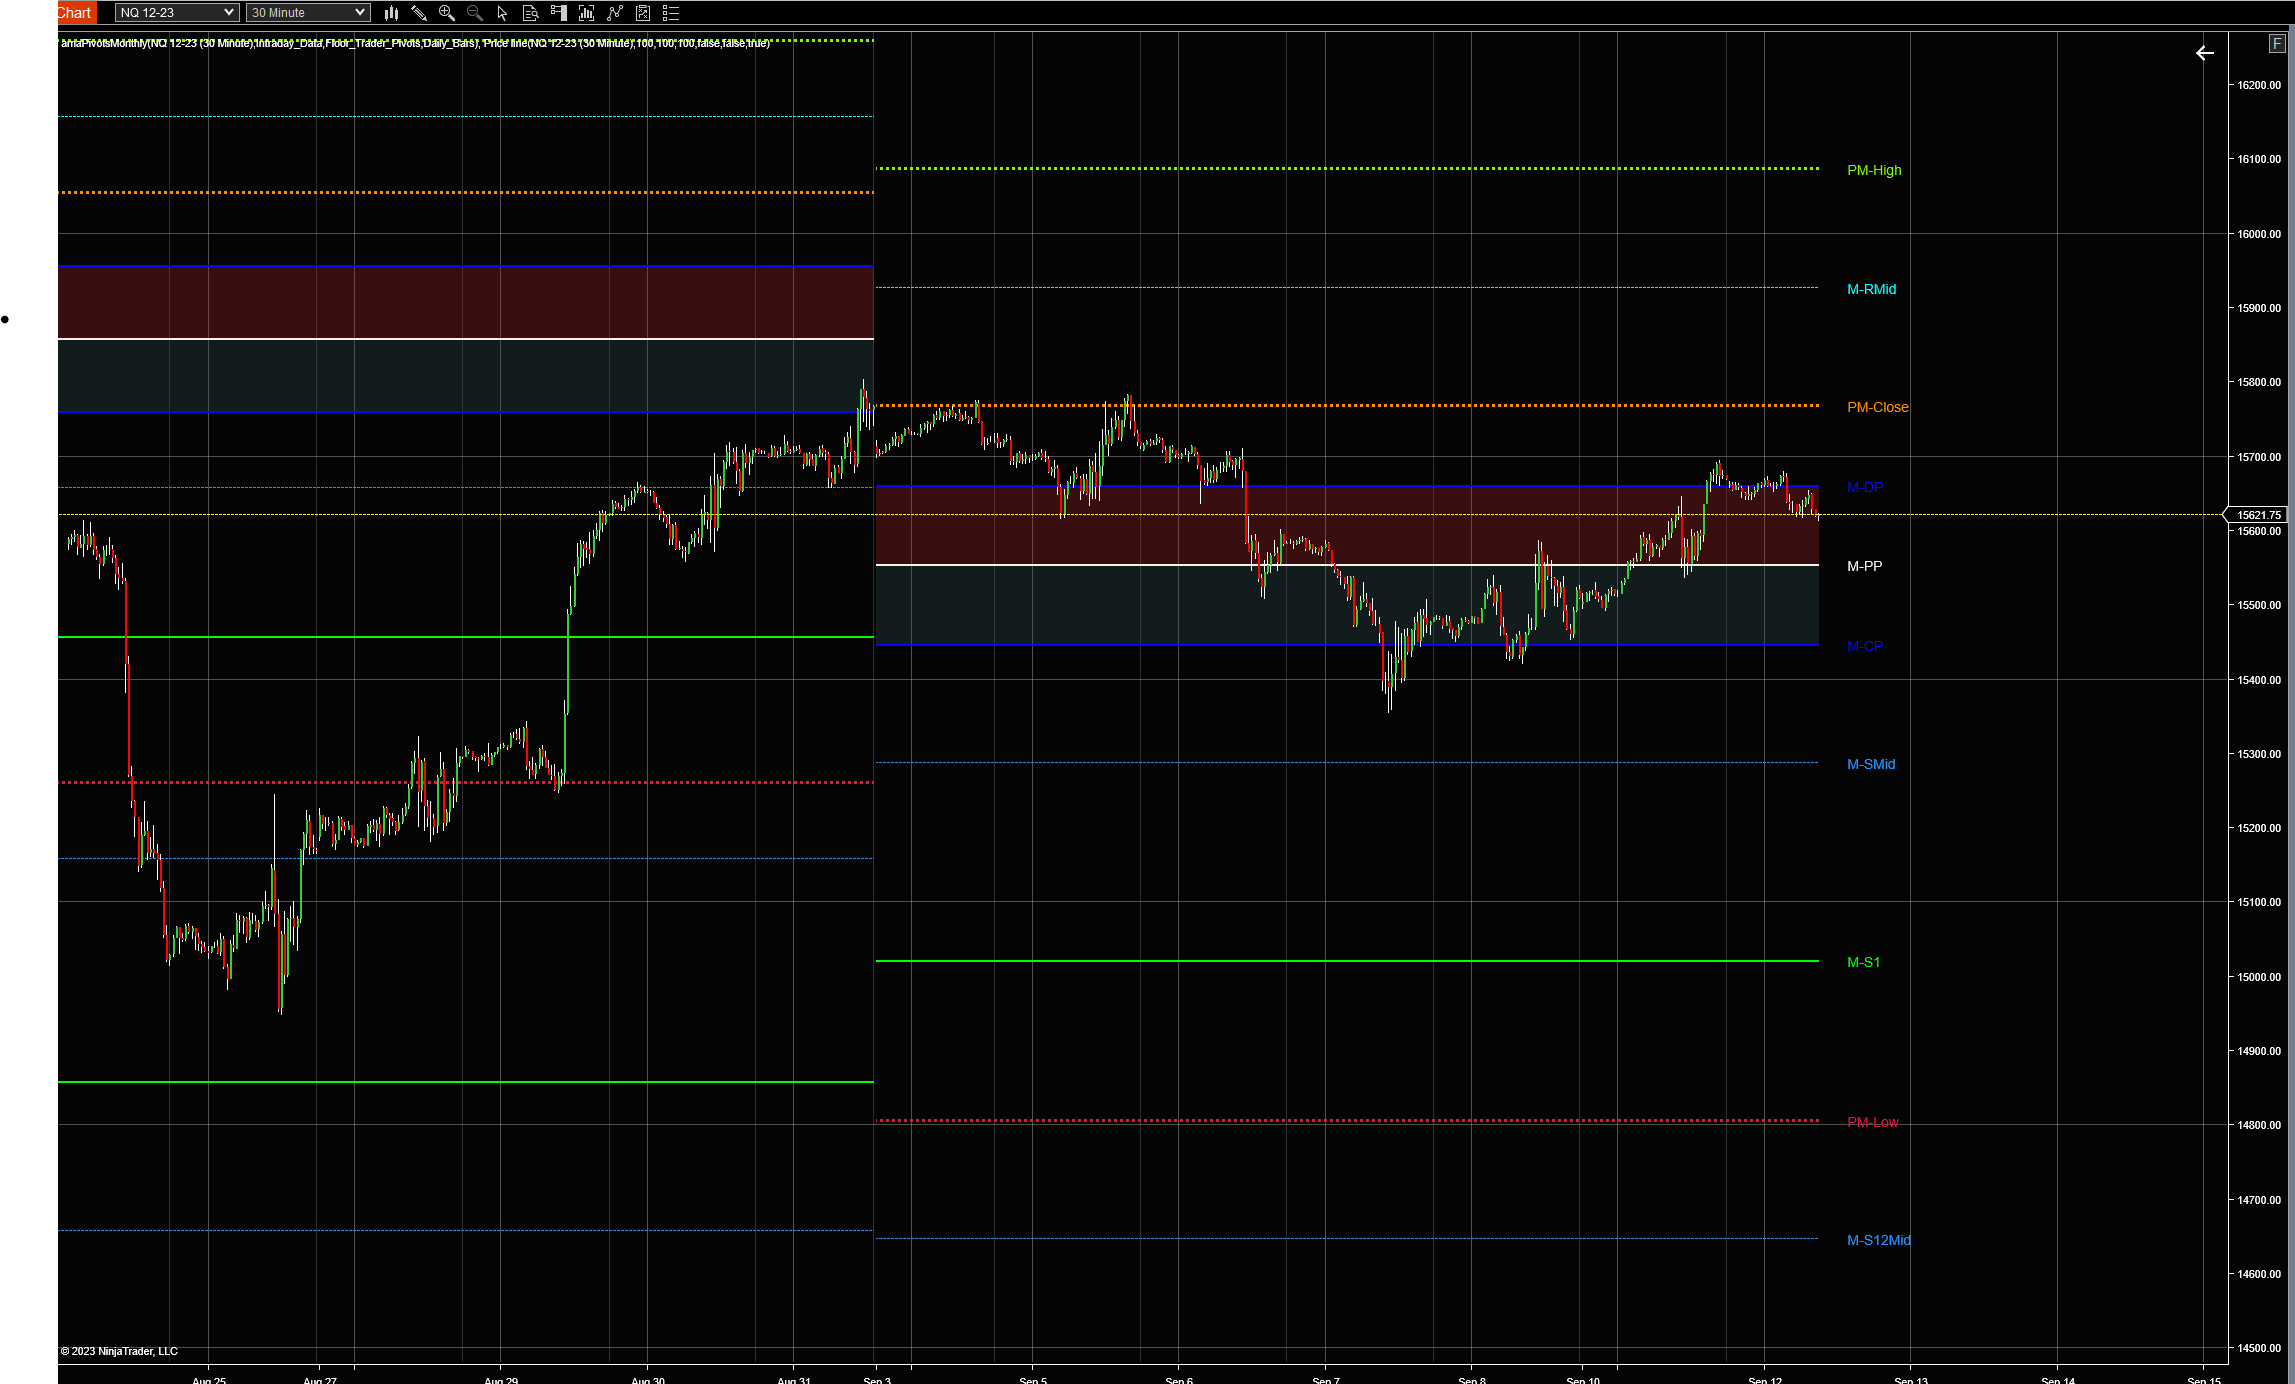
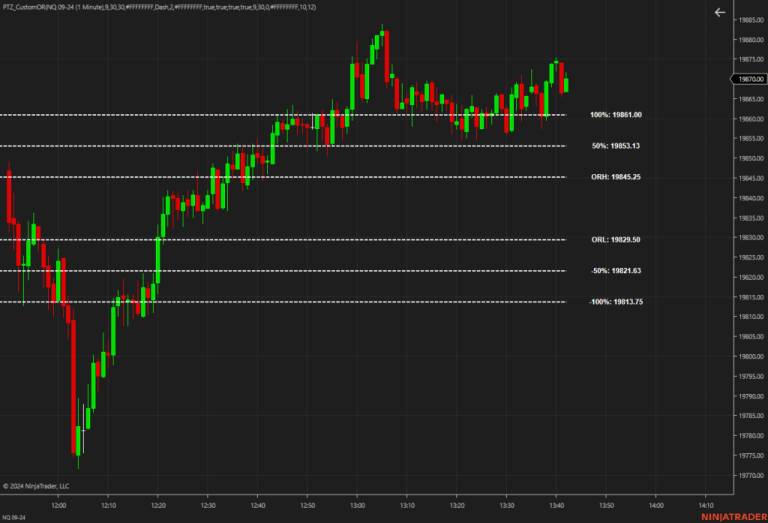
Session Pivots Monthly (amaPivotsMonthly)
The Session Pivots Monthly (amaPivotsMonthly) is an enhanced pivots indicator which allows for displaying floor pivots, wide pivots, Jackson Zones and Fibonacci pivots. All pivots are calculated from daily bars (default setting) or from the bar series that has been selected as input series. The indicator may be used to display ETH pivots on a full session chart or RTH pivots on a regular session chart. It is not designed to display RTH pivots on a full session chart. When pivots are calculated from daily bars, they are typically calculated from the full session high, the full session low and the settlement price. However, the daily data depends on the data…