-
High/Low Envelope
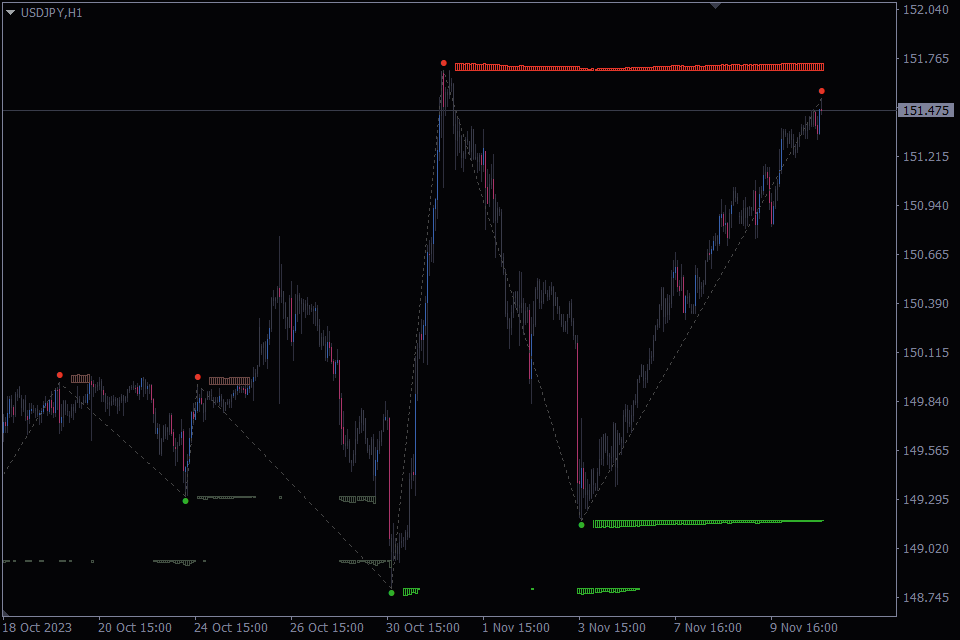
High/Low Envelope Download Introducing the High/Low Envelope Indicator You can find some other free products like the High/Low Envelope also at www.scalpradar.com The High/Low Envelope, a dynamic tool plots the highest and lowest prices reached within a specified number of periods, offering insights into price movements. With default settings analyzing 14 periods, you have the flexibility to adjust properties to suit your preferences. Customize line style and colour, The possibility to choose to plot only high, low, or both, ensuring a tailored experience. Whether you’re identifying support/resistance levels or anticipating breakouts, this indicator provides clarity and precision. Easily navigate parameter settings to fine-tune your analysis. Enhance your trading strategy with…
-
Super Passband Filter
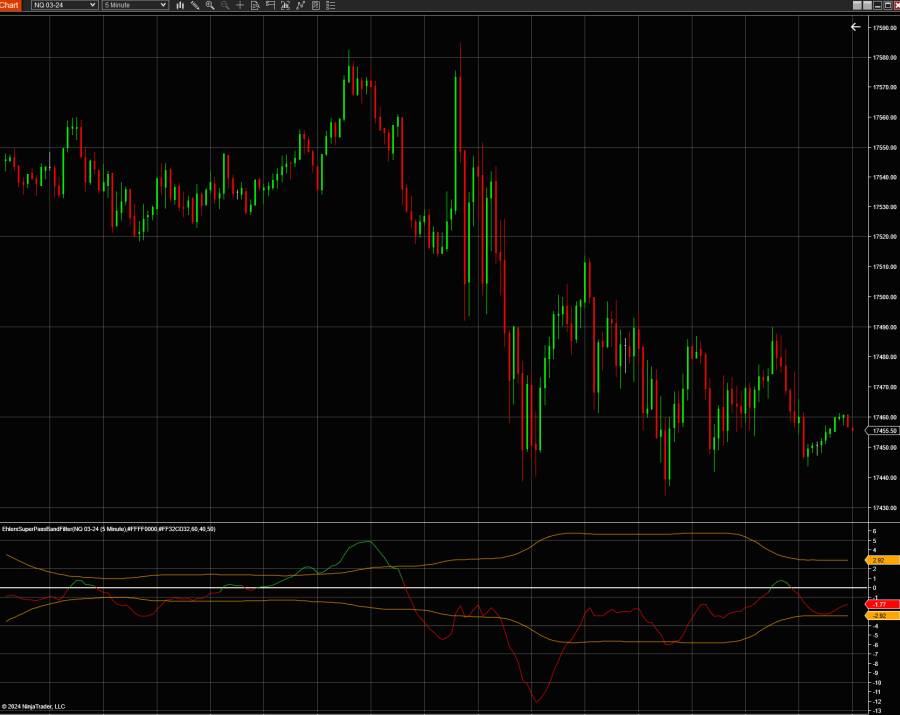
Description The Super Passband Filter is a smoothing technique based on analogue filters. Its main purpose is to filter out unnecessary cycle data and reduce the output lag that many smoothing techniques are prone to. The smoothed and lag-reduced data is represented by the study’s main plot, SuperPassbandFilter. It is calculated as the difference of two exponential moving averages, z-transformed. Signals may be recognized using two reference plots: +RMS and -RMS, calculated as the root mean square of the main plot values. -RMS is +RMS times -1. According to this study Super Passband Filter, an entry signal can be recognized when the main plot crosses above the -RMS; crossing below…
-
NT8-OrderFlow kit
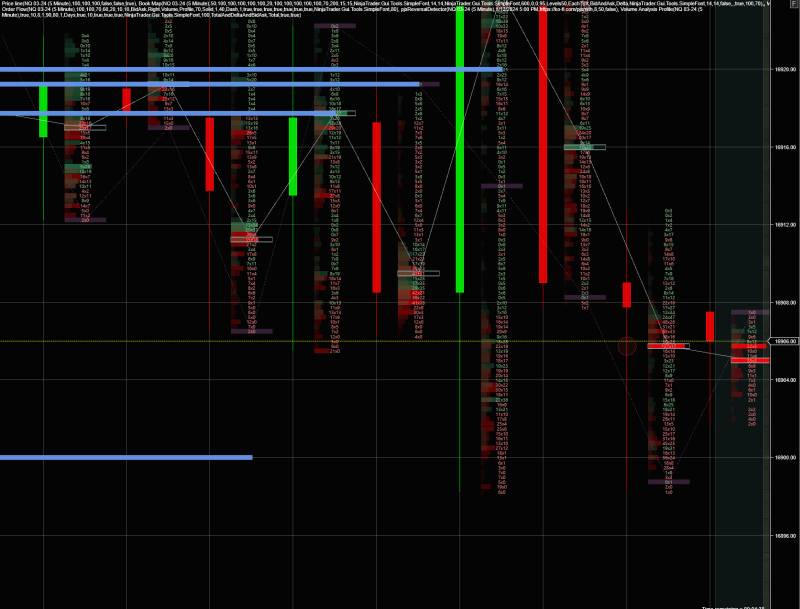
This NT8-OrderFlow kit is a volume analysis toolkit, it is focused on all Futures markets it is based on the Wyckoff method Description: This NT8-OrderFlow kit is a volume analysis toolkit with which you can access to the Bookmap, Order flow, Market volume, Market filter and Volume profile. I designed these tools to be used for investment funds, banks, retail traders, among other entities. With them, you will be able to detect high-frequency trading, contract volume, type-reading, inefficiencies, accumulation, manipulation and other techniques related to professional volume analysis. Many thanks to Gabriel Zenobi for releasing this as NT8-OrderFlow kit a free version! This project is open source, my full code and…
-
The Sine Wave Indicator-John Ehlers
The Sine Wave Indicator-John Ehlers was created by John Ehlers (Cybernetic Analysis For Stocks And Futures pgs 154-155). Buy when the blue line crosses over the red line and sell when the blue line crosses under the red line. How to use The Sine Wave Indicator-John Ehlers 1. Intersections and Turning Points: A key aspect of the Sine Wave Indicator is the crossover points of these two lines. When the Sine line crosses above the Lead Sine line, it can indicate a potential bottom in the market, suggesting a bullish turn. Conversely, when the Sine line crosses below the Lead Sine line, it may indicate a potential market top, suggesting…
-
Ninja Trader toolbar with labeled lines
Ninja Trader toolbar with labeled lines here a few off al features included ⇓ Fibonacci extensions and retracements OrderFlow Volume Profile Angled Line Line, ray and extended line combined Channel GanFan Trend channel tool designed for simplicity Support Line Perfectly horizontal support/resistance line Range Perfectly horizontal trend channel Measured Move Measure 2 equal legs Measure Take measurements between 2 points Arrows 4 more arrow markers with custom size Notes Predefined annotations and multilines text wrapping Standard & Third Party Drawing Tools Pin any drawing tool for quick access Plot Executions Button Plot your trade executions with markers only or text + markers Snipping Tool Button Run Windows snipping tool to…
-
Obsidian Indicator Suite for NinjaTrader 8-Autotrader
Enhance Your Trading with the Obsidian Indicator Suite for NinjaTrader 8 Obsidian Indicator Suite – by Obsidian Indicators Unleash the power of automated trading with the Obsidian Indicator Suite for NinjaTrader 8. A collection of innovative indicators, including the Automated Dark Diamond Trend Sniper, specially designed for precision and adaptability in different market conditions. Start your 7-day free trial here! As market conditions continually shift and evolve, trading strategies need to do the same. That’s why we’ve developed the Obsidian Indicator Suite — an all-encompassing collection of powerful trading indicators, designed exclusively for NinjaTrader 8. The suite integrates our finest indicators, combining robust features and cutting-edge technology, making it an essential…
-
The Joe Ross EMA Strategy Add-on
The Joe Ross EMA (Exponential Moving Average) Crossover Strategy is a trend-following trading strategy developed by Joe Ross, a well-known trader and author. This strategy uses two Exponential Moving Averages with different periods to identify potential entry and exit points in the market. Here’s how the strategy works: Indicators: – EMA 9 (Exponential Moving Average with a period of 9) – EMA 18 (Exponential Moving Average with a period of 18) Entry Rules: 1. Buy Signal (Bullish Crossover): – When the EMA 9 crosses above the EMA 18, it generates a buy signal. – Enter a long position when the bullish crossover occurs. 2. Sell Signal (Bearish Crossover): – When…
You May Also Like

Ninja Trader toolbar with labeled lines

Multiseries Levels
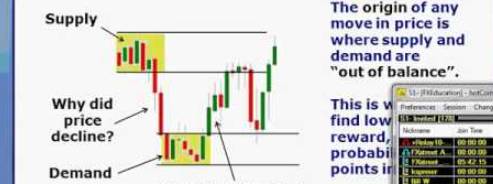
Supply and Demand MT4/5
-
Risk Reward Tool
Risk Reward Tool Ninjatrader comes with a built-in risk/reward drawing tool. However, i like the one from Tradingview much better This drawing tool adds a trading view look-a-like risk/reward tool to ninja trader for both long and short positions When placing an R/R drawing tool on your chart you can move it around, drag the stop loss/target to its correct price levels and the risk/reward ratio will be updated in real time After installing you can find the risk/reward tools under the drawing tools menu. There’s a long-position tool and a short-position drawing tool Note you can assign keyboard shortcuts to the risk/reward drawing tools using the tools->Hot Keys menu.
-
OPENING RANGE ORB -NinjaTrader
OPENING RANGE ORB -NinjaTrader is the range obtained from the highest and lowest price of a security during the first minutes of daily trading activity. For example the opening range can be calculated from the first 5, 15 or 30 minutes. The opening period can be selected via the time zone, the start time and the end time of the opening period. For example, if you wish to display a 30-minute opening range for ES, you would select Exchange_Time or US_Central_Standard_Time, a start time of 8:30 AM and an end time of 9:00 AM. The indicator will then display the regular open and the opening range high, low and midline.…
-
FootPrintV2 Chart for NT8
In trading, a footprint chart is a type of price chart that displays the volume of trades at each price level, rather than simply showing the price movements over time. Footprint charts are often used by traders to identify support and resistance levels, track the buying and selling pressure in the market, and detect potential trend reversals. A footprint – FootPrintV2 Chart for NT8 chart works by dividing the price range into small price increments, and then displaying the volume of trades that occurred at each price level using different colours or shades. The resulting chart shows the distribution of trading activity across the price range, highlighting areas of high…