

PTZ Multi-Instrument Levels
Advanced Support & Resistance for NinjaTrader 8
Send download link to:PTZ Multi-Instrument Levels
This indicator helps you identify and visualize Advanced Support & Resistance for NinjaTrader 8. The PTZ Multi-Instrument Levels indicator is a great tool. Designed for traders who deal with multiple assets, this indicator automatically plots significant price levels, highlighting areas of interest with customizable zones.
The PTZ Multi-Instrument Levels indicator is built to automatically detect and plot support and resistance levels for a wide range of instruments, including forex, futures, and crypto. It helps traders identify key levels where the price is likely to react, making it easier to spot potential trade setups.
Key Features:
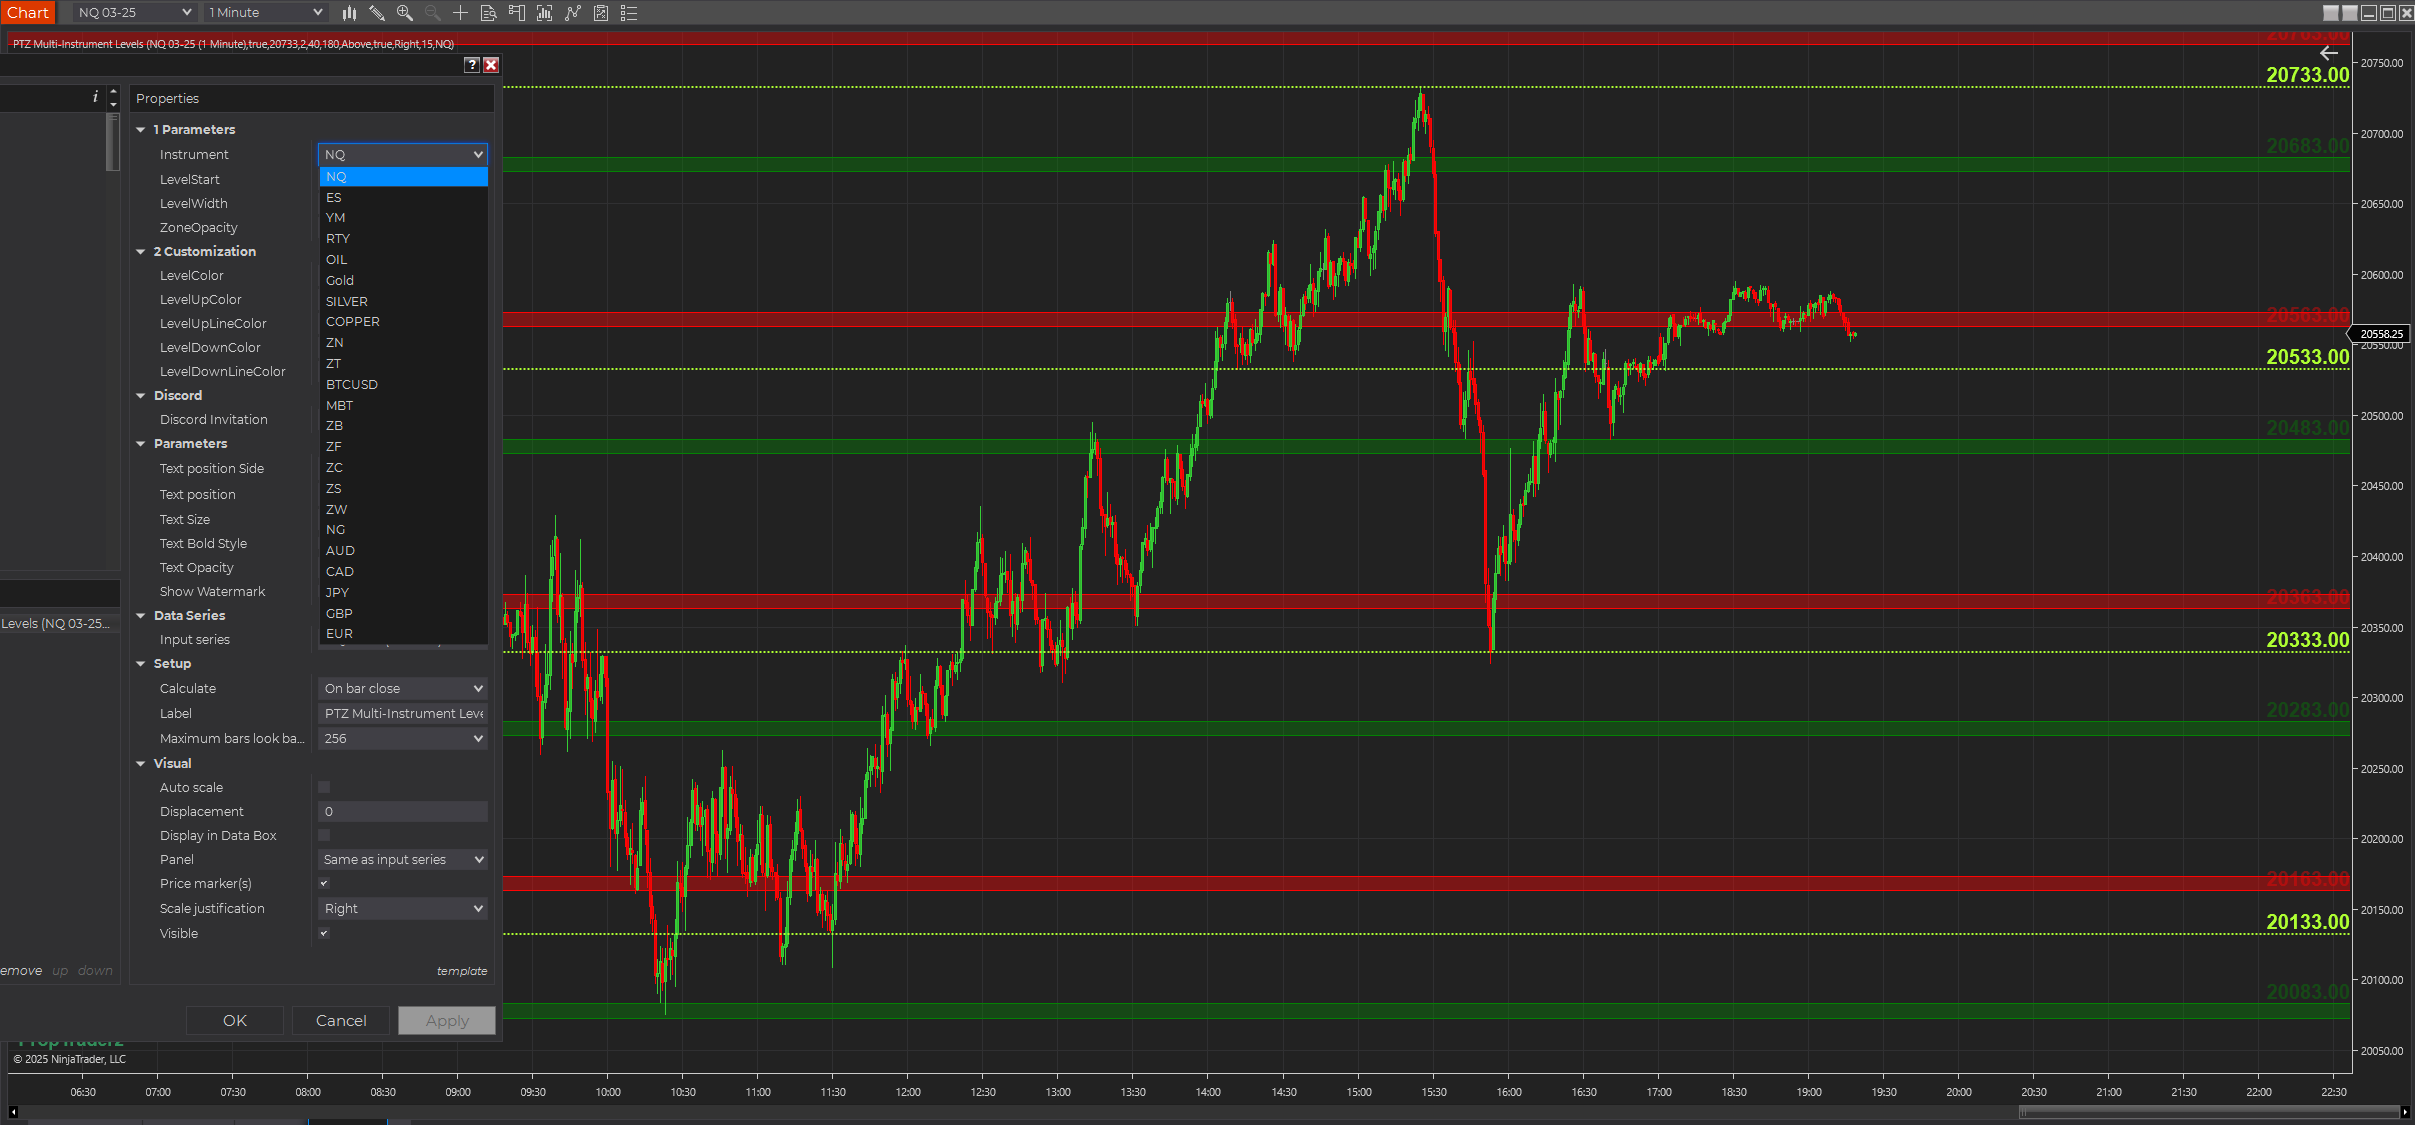
✅ Multi-Instrument Support – Works across assets like NQ , ES, YM, RTY, OIL, Gold , SILVER , COPPER, ZN , ZT , BTCUSD , MBT , ZB , ZF , ZC , ZS , ZW , NG , AUD, CAD, JPY , GBP , EUR
✅ Automatic Support & Resistance Levels – The indicator calculates levels based on a user-defined pivot point, such as a daily high/low, swing level, or key market structure.
✅ Dynamic Zones – It highlights key levels with customizable zones, making them easy to see on your chart.
✅ Customization – Adjust color, opacity, line style, and text labels to match your personal preferences.
The core of the PTZ Multi-Instrument Levels indicator revolves around its LevelStart parameter. This is the base level from which all support and resistance levels are derived. Depending on your trading instrument, the indicator calculates upper and lower levels using predefined logic.
Each level is then highlighted with a zone to indicate an area of price action interest. The zones can be adjusted in width and opacity, helping you tailor visibility to your needs.
How to Use PTZ Multi-Instrument Levels in Your Trading
Configure Key Settings
Here are the most important settings you’ll want to adjust:
- Instrument → Select the instrument you are trading (e.g., NQ, ES, GC, CL, BTCUSD, etc.).
- LevelStart → Choose a starting level, such as a daily pivot or a major swing high/low.
- LevelWidth → Adjust how thick the plotted lines appear on the chart.
- Zone Opacity → Set the visibility of the support/resistance highlight zones.
- Text Size & Position → Customize where the price labels are displayed.
- Watermark → Enable or disable the watermark feature.

Once configured, the indicator will automatically draw key levels. Use these levels to:
- Identify high-probability trade zones.
- Spot breakout and reversal opportunities.
- Manage risk with well-defined stop-loss and profit targets.
Example Chart with PTZ Multi-Instrument Levels
Below is an example of how the indicator looks on a Crude Oil (CL) chart:

📌 Thick horizontal lines indicate strong support & resistance.
📌 Shaded zones represent areas where price is likely to react.
📌 Customizable text labels display the price level of each key area.
By visually mapping out these levels, traders can anticipate price movements and plan their trades accordingly.
Why Use This Indicator?
🚀 Saves time by automatically plotting key levels.
📊 Works on multiple markets including futures, forex, and crypto.
🛠️ Fully customizable .
💡 Helps identify potential trade opportunities with clarity.