

The Sine Wave Indicator-John Ehlers was created by John Ehlers (Cybernetic Analysis For Stocks And Futures pgs 154-155).
Buy when the blue line crosses over the red line and sell when the blue line crosses under the red line.
How to use The Sine Wave Indicator-John Ehlers
1. Intersections and Turning Points: A key aspect of the Sine Wave Indicator is the crossover points of these two lines. When the Sine line crosses above the Lead Sine line, it can indicate a potential bottom in the market, suggesting a bullish turn. Conversely, when the Sine line crosses below the Lead Sine line, it may indicate a potential market top, suggesting a bearish turn.
2. Cycle Identification: The indicator helps in identifying the start and end of market cycles. The distance between two consecutive high or low crossover points can give an idea about the cycle length.
SineWaveExtendedLines
Send download link to:
This indicator was modified to plot lines as signals when the buy-sell signals occur.
In addition one can play sounds attached to the crossover signals.
Horizontal Lines or Dots or Sounds Alerts can all be switched on/off by users in the indicator properties windows.
Horizontal lines and dots were added to the Highs/Lows of the corresponding crossover points Sine Wave curve.
This leading indicator is also called the MESA indicator and was developed by John Ehlers based on an algorithm that was originally applied to digital signal processing. It consists of two lines, called the Sine Wave and the Lead Wave
KEY TAKEAWAYS
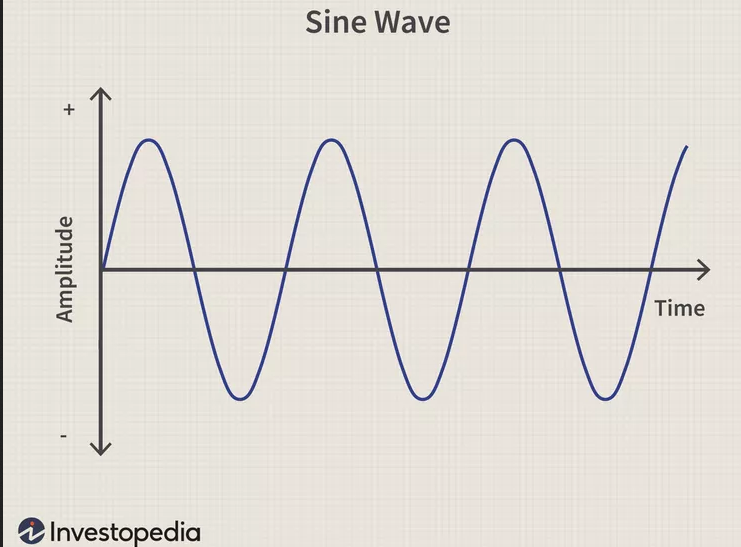
A sine wave is an S-shaped waveform defined by the mathematical function y = sin x.
It is depicted graphically as two semi-circular curves that alternate above and below a center line.
In finance, market participants may identify cyclical patterns or oscillator signals from sine-wave-based functions.
The sine wave as a technical chart analysis tool is based on advanced mathematics and is designed to indicate whether a market is trending or in a cycle mode.
Sine waves are the basis of Fourier decomposition analysis.
Understanding Sine Waves
The sine wave indicator is based on the assumption that markets move in cyclical patterns. After quantifying a cycle, a trader may try to use the pattern to develop a leading indicator. This works extremely well when the market is indeed moving in a cycle. When the market is trending, however, this system fails (and one should adjust for that).
Markets alternate between periods of cycling and trending. Cyclical periods are characterized by price bouncing off support or resistance levels and failed breakouts or overshoots. Trending periods are characterized by new highs or new lows and pullbacks that then continue in the direction of the trend, until exhausted.